
What University Campus Occupancy Analytics Can Show You
Category
Category

DAte
June 22, 2026
Category
Share
.svg)
.svg)

Most campus space decisions still rely on registrar schedules and booking systems that show what's planned, not what actually happens.
Lecture halls get booked at 85% capacity while real attendance runs closer to 40–60%. Buildings get flagged for expansion while others sit half empty across the quad.
Butlr has deployed occupancy sensors across multiple higher education campuses, and the findings are surprisingly consistent. There's a noticeable gap between how campus space is scheduled and how it's used, which is bigger than most institutions realize.
Campus occupancy analytics uses sensors to count how many people occupy a space, when they arrive, and how long they stay. It replaces estimates pulled from class schedules, booking systems, and badge data with real-time data on space utilization.
Those systems describe intent, not behavior. If a hall is reserved for 200 students and 70 show up, the booking system would still record a full room.
The findings below are recurring occupancy patterns from Butlr sensor deployments across higher education campuses, organized by the space types planners weigh most heavily. The numbers are representative examples of those patterns, not results from a single institution.
Show-rate analytics compare scheduled enrollment to measured peak occupancy for each building and time block. Plotted across a Monday through Friday schedule, the resulting heatmap makes peak usage times and attendance trends visible at a glance.
The contrasts can be dramatic. In a typical week, a 10 a.m. engineering lecture might run at 91% of capacity with students standing in the back, while afternoon liberal arts sessions across the quad might dip below 30%.
Two patterns recur across higher ed deployments:
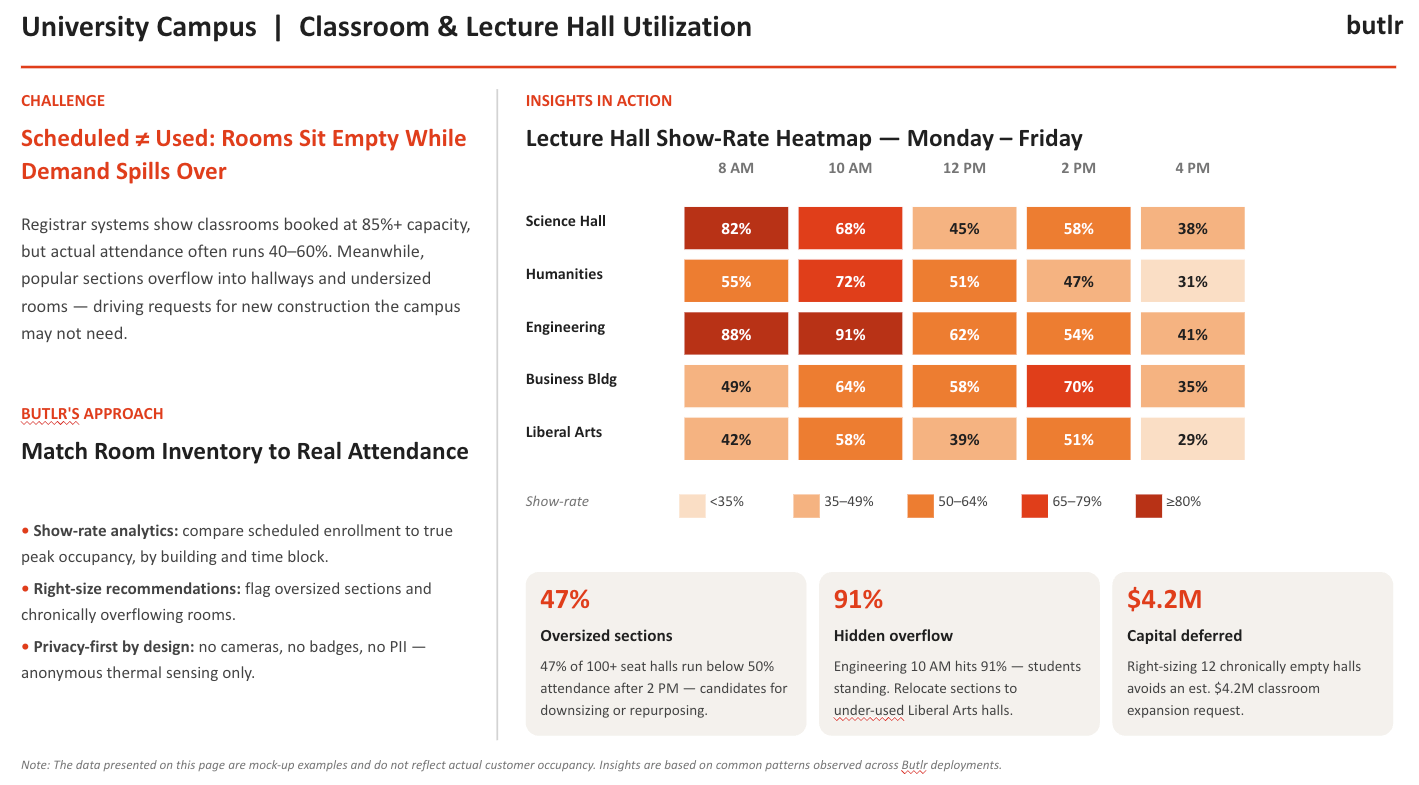
The savings scale quickly. On a campus with a dozen chronically low-attendance halls, right-sizing those rooms would defer an estimated $4.2 million in classroom expansion requests.
Want to see what show-rate data looks like for your campus? Let's talk.
Private offices are the most requested space on campus and often the least used. They're assigned one-to-one and rarely reassigned, even as sabbaticals, adjunct schedules, and hybrid office hours leave them empty most of the week. Meanwhile, new hires can wait years for space.
Sensors put numbers to the gap. In a typical 40-office wing, 27 offices (68%) might show occupancy under 20% of the week. Peak occupancy across the wing on its busiest day might reach just 32%.
Numbers like those would support shifting assignment ratios from 1:1 to roughly 2.5:1 without displacing anyone during real peak usage. In a wing that size, the shift would recover around 16,000 square feet for visiting scholars or new hire allocation, all without new construction.
Privacy concerns run high among faculty, so the sensing method counts as much as the data. Thermal sensors detect presence through body heat alone. The hardware can't capture images, audio, or identity data, which makes privacy a physical constraint rather than a software setting.
Conference rooms and study commons have opposite visibility problems. Bookable rooms often reserve hours that never happen, while the spaces students rely on send no booking signal at all.
The data quantifies both sides:
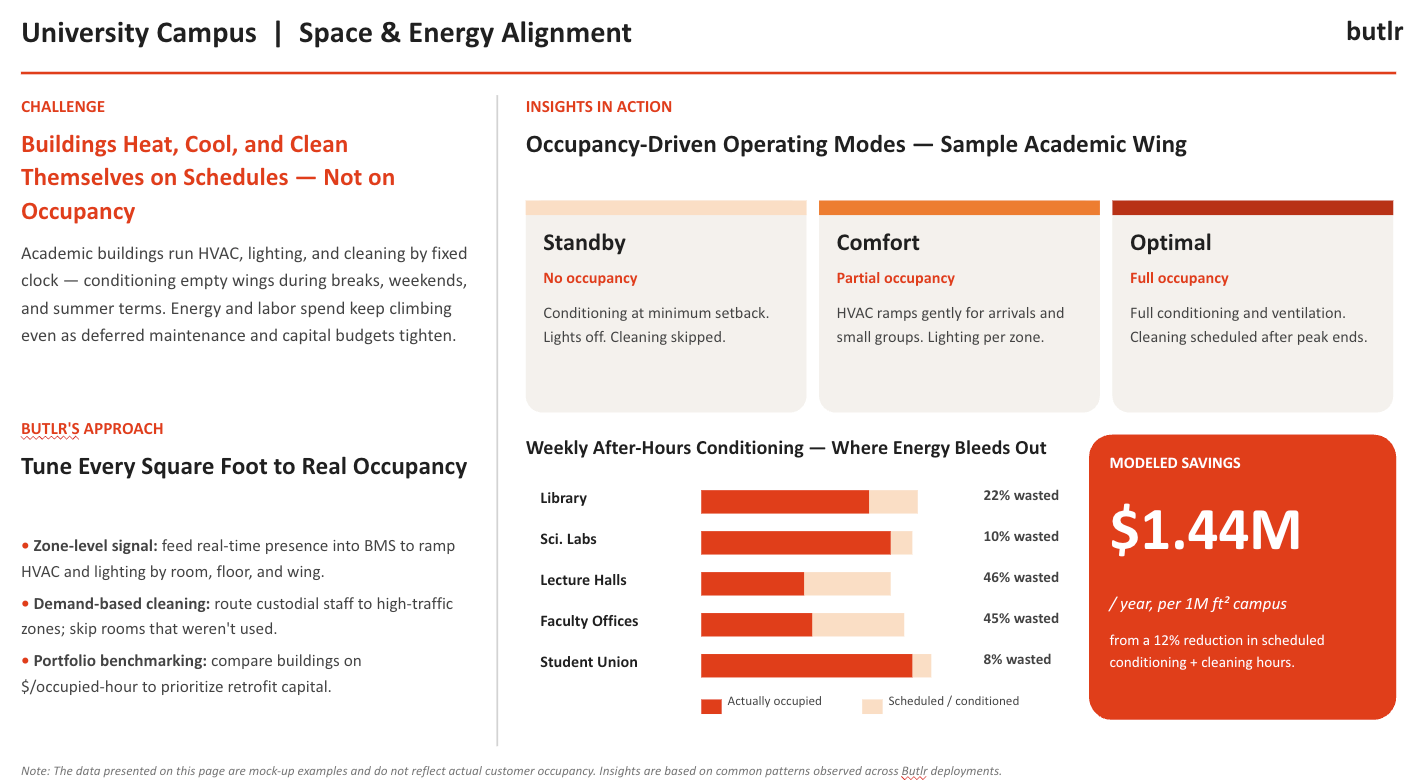
Academic buildings run HVAC, lighting, and cleaning on fixed schedules. Those schedules follow the clock rather than occupancy, so empty wings get conditioned through breaks, weekends, and low-enrollment terms. Energy and maintenance costs keep climbing as a result.
Energy waste runs highest where occupancy is lowest. In a typical week of after-hours conditioning, lecture halls might waste 46% of their conditioned hours and faculty offices 45%, while a heavily used student union might waste just 8%.
Occupancy data corrects this by feeding presence signals into the building management system (BMS) to set zone-level operating modes:
Cleaning follows the same logic. Custodial teams route to high-traffic zones and skip rooms that went unused, improving resource allocation without adding headcount.
The energy efficiency gains add up across a full campus. A 12% reduction in scheduled conditioning and cleaning hours would cut operational costs by an estimated $1.44 million per year on a 1 million square foot campus.
Occupancy solutions often look interchangeable on a spec sheet. But campus environments, with their fixed calendars, wary faculty, and fragmented tech stacks, expose the differences quickly. Before committing to a space management solution, check it against four criteria:
Start occupancy planning with a building or floor that has known usage problems. Good candidates include the lecture hall wing the provost wants to expand, the faculty office floor with a waitlist, or the library everyone knows is overcrowded.
Align deployment to the academic calendar. Install as quickly as overnight during a break, collect a full semester of data, and present findings before the next budget cycle. The faster the data lands, the sooner it replaces gut instinct in decisions already underway.
Use the pilot as an internal case study to validate ROI before scaling. For academic affairs and facilities leaders, a deferred $4.2 million capital request justifies campus-wide deployment on its own.
If you want to see how your campus space is really used, get a demo of Butlr.

West Coast, US
800 Airport Blvd
Burlingame, CA 94010
East Coast, US
501 Mass Ave
Cambridge, MA 02139
Japan
CIC, 1 Chome-17-1 Toranomon,
Minato City, Tokyo 105-6415

.png)

.png)
.png)
.webp)