

.svg)

Occupancy Planning: A Practical, Step-by-Step Guide
A Butlr survey of 400 U.S. building and facilities decision makers found that only 19% base their space-planning decisions mostly on data. More than a third rely primarily on gut instinct drawn from experience.
Among those who depend on instinct, nearly nine in ten say data challenges have actively hampered their planning. The result is 99% of respondents reported data gaps that disrupted at least one major business decision in the past five years, from stalled renovations to canceled expansions to postponed energy investments.
Occupancy planning is how you close that gap. This guide walks through the process step by step. We’ll cover how to define what you're solving for, which metrics to focus on, how to collect occupancy data you can actually trust, and how to translate those numbers into decisions about layout, operations, and cost.
What Is Occupancy Planning?
Occupancy planning is the process of allocating people to space based on demand patterns, workplace policies, and business goals. Its outputs are strategic, including target utilization rates, consolidation recommendations, stack plans, and cost-per-seat projections. It's forward-looking by design.
Occupancy planning is often confused with two related functions:
- Space planning takes occupancy planning outputs and translates them into physical layouts like adjacencies, seat types, and floor configurations. It answers "what should this floor look like?"
- Occupancy management handles day-to-day operations like desk bookings, seating assignments, and move coordination. It keeps the plan running once it's in place.
These three functions are sequential. This guide focuses on the first step.
The Occupancy Planning Process Broken Down Into 4 Steps
Step 1: Set the Target Before You Start Measuring
Before collecting any data, define what the data needs to accomplish. Most occupancy planning programs map to one of four goals. Pick one primary and one secondary objective before moving forward.
Cost reduction
This is the most common starting point. The portfolio feels oversized for actual use, and the goal is to consolidate floors, renegotiate leases, or shed buildings entirely. Decision makers in Butlr's survey report paying to heat, cool, clean, and maintain space that goes unused week after week.
Hybrid work optimization
Attendance patterns are unpredictable. Some days the office is packed, others nearly empty. The goal is right-sizing so peak days don't feel overcrowded while off-peak days don't feel deserted. This is increasingly relevant as organizations shift toward more structured hybrid models with fixed in-office day requirements.
Productivity and employee experience
Butlr's survey found that 76% of decision makers are concerned their current layout isn't delivering the most productive use of space. That concern shows up as complaints about meeting room availability, noise levels, and the wrong ratio of focus to collaboration space. Separately, 78% believe improved workspace design would improve employee retention.
Operational efficiency
The goal here is tying building operations (cleaning, HVAC, lighting, maintenance) to actual usage instead of fixed schedules. Occupancy data at this level stops being a planning input and starts reducing the cost of daily facilities management.
Step 2: Map Your Metrics to Your Goal
Not every metric matters equally for every objective. These five are the ones that come up most in enterprise occupancy planning, and each connects to different decisions.
Utilization rate is the most important metric for cost reduction and portfolio right-sizing — our workplace utilization guide breaks down all five metrics worth tracking and how they fit together.
Peak occupancy is critical for hybrid work optimization because it tells you how much space you need on the busiest day, not the average day.
Occupancy rate surfaces misallocated space, like conference rooms that seat ten but routinely host two.
Dwell time reveals whether spaces are being used as intended: short dwell in a collaboration area may signal it's a pass-through, not a destination, while long dwell in a hot-desk zone may mean people are treating flex seats as assigned desks.
Traffic and flow is most valuable for operational decisions like cleaning priorities, wayfinding, and bottleneck identification.
To keep the project focused, start with the metrics tied to your primary objective from Step 1. Portfolio right-sizing leans on utilization rate and peak occupancy. Operational efficiency depends on traffic, dwell time, and space-level occupancy rate. Most organizations eventually need all five, but trying to measure everything at once slows down the first decision.
Step 3: Collect Data You Can Actually Trust
This is where most occupancy planning programs run into trouble. The survey data shows why. No single method dominates, and most organizations are cobbling together data from multiple sources that were never designed to answer "how is this space actually being used?"
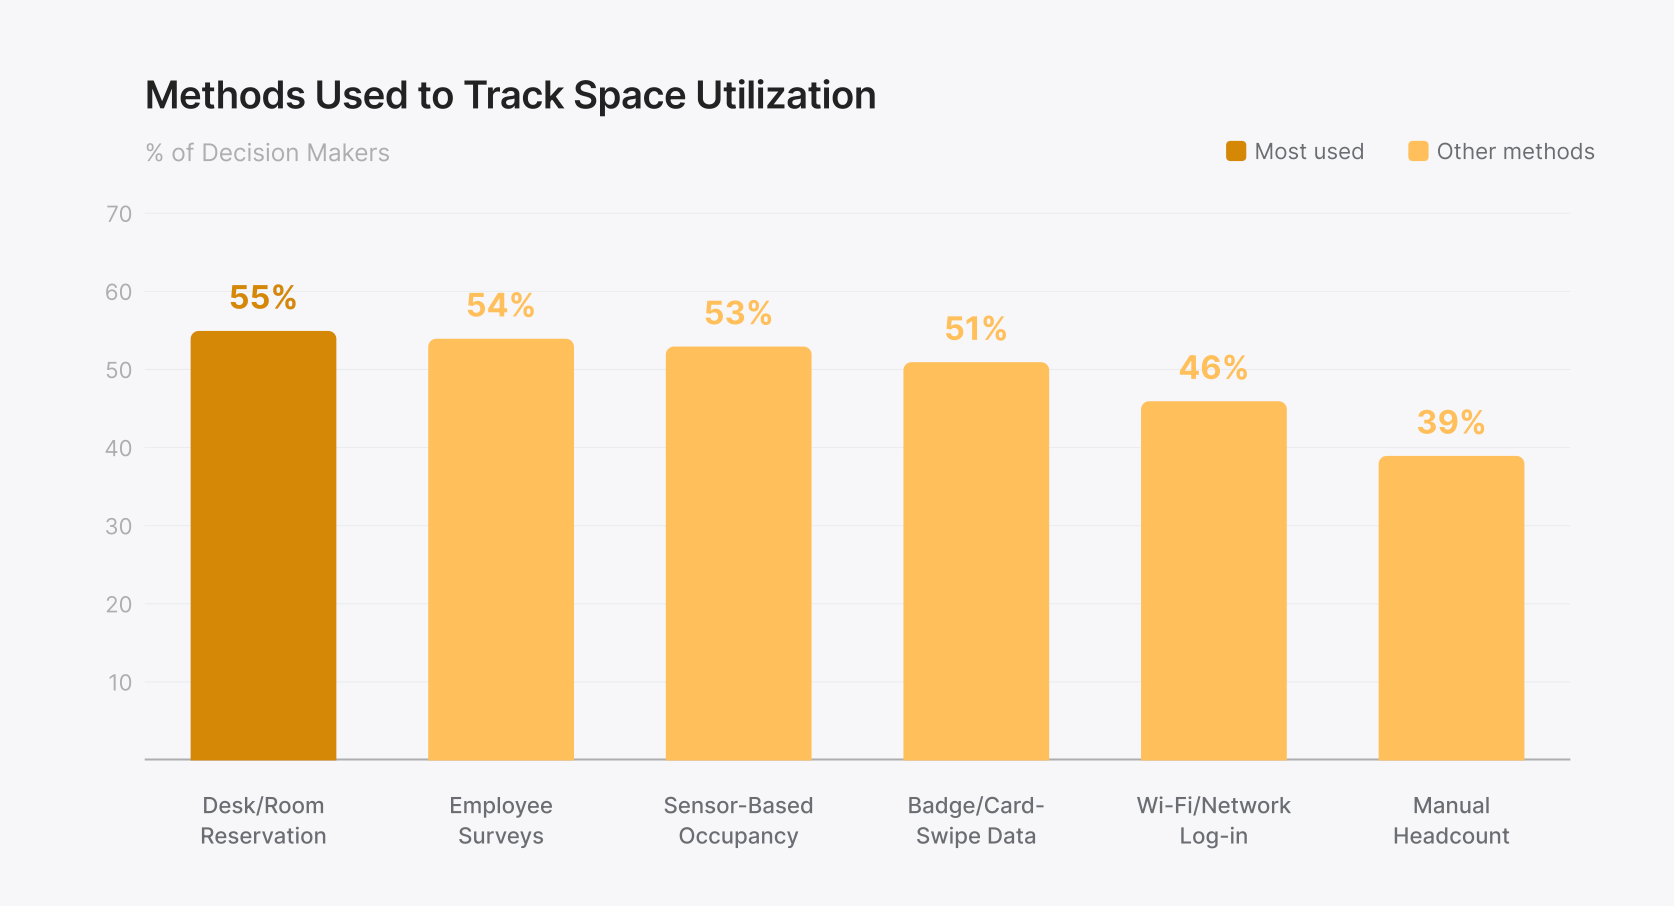
Current adoption rates for space data collection:
- Desk/room reservation systems: 55%
- Employee surveys: 54%
- Sensor-based occupancy detection: 53%
- Badge/card-swipe data: 51%
- Wi-Fi/network log-in data: 46%
- Manual headcount: 39%
Each method captures something useful, and each has a blind spot that matters.
Badge/access data captures who entered the building, not where they went. A building can show 70% badge-ins and still have entire floors sitting empty. Picture a 10-floor building where badge data shows 700 people entering each morning. That looks healthy on paper. But if 500 of them work on floors 2 through 5 and floors 8 through 10 are running at 15% occupancy, you're heating, cooling, and cleaning five nearly empty floors based on a building-wide number that hides the problem.
Desk/room reservation systems show what was booked, not what actually happened.
Employee surveys provide qualitative context, but they're subjective, infrequent, and prone to recency bias. They’re snapshots, not continuous signals.
Wi-Fi/network data is a loose proxy for presence that can't distinguish between someone working at a desk and a phone left in an empty room.
Manual headcounts are labor-intensive, episodic, and hard to scale: one data point for one space at one moment.
Sensor-based occupancy detection is the only method designed specifically for the utilization question. But the technology matters. PIR sensors detect motion, not presence. A person sitting still registers as absent.
Camera-based systems offer accuracy but introduce privacy and legal barriers. Butlr's survey found that 92% of decision makers flag privacy as a concern when evaluating occupancy sensors.
Thermal sensing works differently. It detects body heat to measure presence and count occupants without capturing images or personally identifiable information.
What Good Data Actually Requires
Butlr's survey found that 62% of decision makers can't learn about unexpected space usage without directly asking or observing employees. Two shifts close that gap.
- Space-level, not building-level. Total badge-ins tell you nothing about which floors were crowded, which rooms sat vacant, or whether a renovation is working. Without space-level detail, occupancy data doesn't connect to actual decisions.
- Continuous, not episodic. Periodic audits and quarterly surveys can't reveal the conference room that's booked but empty every Tuesday, the quiet floor that fills up after 4 p.m., or the wing running HVAC all weekend for nobody. Those patterns only emerge from continuous measurement.
The survey also surfaced the barriers teams face when trying to upgrade: scalability (55%), integration with existing systems (48%), and time to install and begin collecting data (90% expressed concern).
Butlr's thermal sensors were built for exactly these barriers: battery-powered hardware that installs in minutes, an API-first platform that plugs into existing systems, and technology that passes legal and works council review because there's no PII to debate. Learn more about Butlr here.
Step 4: Turn Data Into Decisions
Occupancy data only matters when it changes a decision.
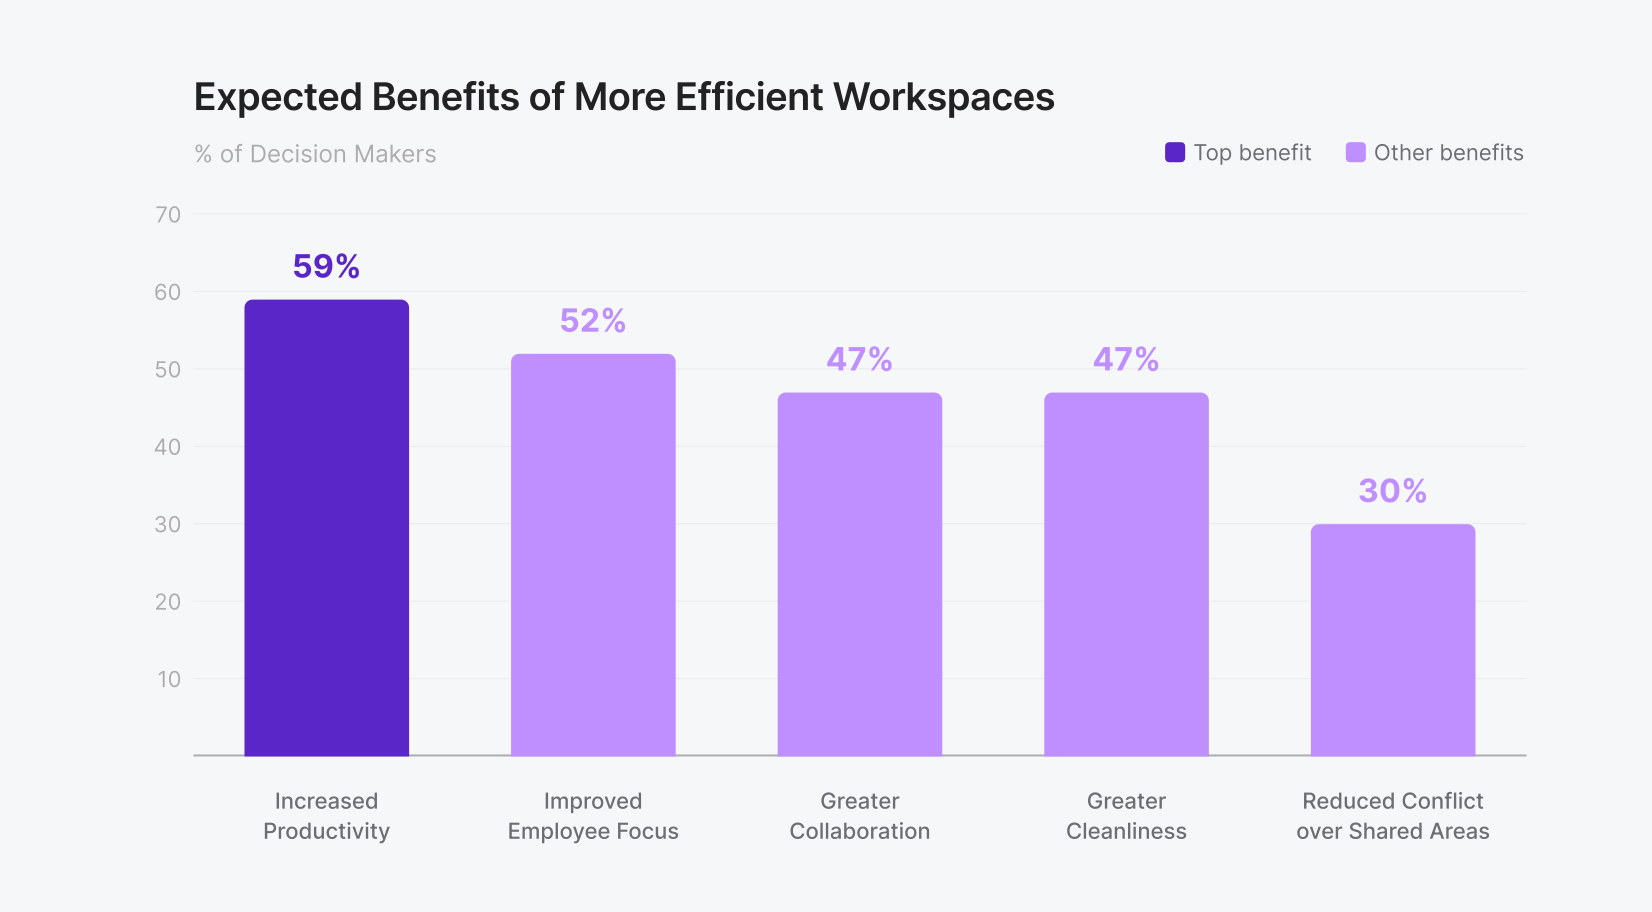
Butlr's survey found that 99% of decision makers expect improvements in space efficiency to produce meaningful benefits beyond cost reduction, including increased productivity (59%), improved employee focus (52%), greater collaboration (47%), and greater cleanliness (47%).
Those benefits tend to show up first in four areas.
1. Portfolio right-sizing
Utilization rate and peak occupancy data collected over several weeks creates a usage baseline, revealing which floors, buildings, or zones are consistently underused. That data directly informs consolidation, lease negotiations, and expansion planning.
If three months of data show your fourth floor never exceeds 30% utilization while floors two and three regularly hit 75%, that's a concrete case for consolidating onto fewer floors before your lease renewal, not a hunch you have to defend in a budget meeting.
The survey found that 52% of respondents had delayed or canceled expansion plans and 44% had put consolidation on hold, specifically because they lacked reliable space usage data. The holdups weren't strategic disagreements. Teams simply didn't have the data to justify the decision.
2. Demand-based cleaning
Two-thirds of buildings in the survey clean all areas at the same frequency regardless of actual use. Only 18% base cleaning schedules on per-space occupancy data. Traffic and occupancy insights at the zone or room level enables facilities teams to prioritize high-traffic areas and skip unused spaces, reducing labor and materials costs without affecting experience. 60% of respondents identified this as where better utilization data could yield measurable savings.
3. Energy optimization
Decision makers estimate 24% of their space is heated or cooled for nobody in a typical week. Real-time occupancy data connected to BMS and HVAC systems allows setpoint adjustments based on actual presence instead of fixed schedules.
Think about what that looks like in practice. If occupancy data shows your east wing is empty every Friday afternoon, your BMS can automatically dial back HVAC in that zone rather than conditioning 20,000 square feet of space for nobody.
62% identified energy as the top category for measurable cost savings from better data.
4. Layout and renovation planning
79% of respondents said data challenges had hindered layout changes, and for 25%, it was a significant obstacle. Space-level data answers the questions that stall renovations: Is the open-plan area actually used for collaboration? Are huddle rooms in demand or just taking up space? Does the neighborhood layout support actual work patterns?
Common Occupancy Planning Mistakes
After helping hundreds of companies learn how to use their spaces more efficiently, here are the most common mistakes we see:
- Planning for average instead of peak. Average utilization might be 50%, but if Wednesdays consistently hit 85%, the space needs to accommodate that peak. Planning for the average means half the workforce is uncomfortable on the busiest days.
- Treating booking data as ground truth. Reservation systems capture intent, not behavior. The gap between booked and actual occupancy is one of the most common blind spots in workplace planning. An occupancy plan built on reservation data alone is built on assumptions.
- Collecting data without a decision framework. Data collection is not the goal. Decisions are the goal. Organizations that deploy sensors without first defining what they're solving for end up with dashboards full of numbers and no clear path to action.
Better Data, Better Decisions, Less Wasted Space
Occupancy planning works when it starts with a clear question, measures the right things, and connects data to decisions. Most organizations have the intent. The gap is the infrastructure between what they want to know and the tools that can tell them.
Most occupancy planning programs stall at the data collection step. The technology takes too long to deploy, triggers months of privacy review, or produces numbers that don't connect to the systems where decisions actually get made.
Butlr was designed to remove those barriers: thermal sensors that install in minutes, capture presence and traffic without cameras or PII, and push data directly into your BMS, IWMS, or BI platform through an API-first architecture. With over 30,000 sensors deployed across commercial buildings worldwide, Butlr helps organizations move from planning on assumptions to planning on real occupancy data. Learn more here.
%20(1).png)

.png)
.png)
.webp)

Contact
Let’s create your next big project together.
Subscribe to our newsletter
Oops! Something went wrong while submitting the form.
West Coast, US
800 Airport Blvd
Burlingame, CA 94010
East Coast, US
501 Mass Ave
Cambridge, MA 02139
Japan
CIC, 1 Chome-17-1 Toranomon,
Minato City, Tokyo 105-6415
