

.svg)

Office Space Monitoring: Myths, Methods & More
"Office space monitoring" is one of those terms that means very different things depending on who you ask.
For a Head of Workplace Strategy, it might mean understanding how conference rooms are actually used so the company can stop paying for space no one sits in. For an employee hearing the phrase for the first time, it can sound a lot like surveillance.
That gap in perception is challenging for organizations that need space utilization data to make decisions about their real estate portfolio, hybrid policies, or building operations. The data itself is straightforward and useful. But if employees don't trust how it's being collected, you’ll get a lot of unwanted pushback.
What Is Office Space Monitoring?
Office space monitoring is the practice of collecting data on how physical spaces are used so organizations can make informed decisions about real estate, operations, and workplace policies. It answers questions that would otherwise require guesswork: Which floors are consistently underutilized? Are conference rooms booked but sitting empty? Does Tuesday's attendance pattern look anything like Thursday's?
The goal is to understand how a building functions across hours, days, and months so that leadership can align their space with how people actually work.
What It Captures vs. What It Doesn't
The clearest way to understand office space monitoring is to look at what the data includes and what it leaves out.
What monitoring systems typically capture:
- Occupancy counts, meaning how many people are in a given space at a given time
- Utilization rates, or how often a space is used relative to its capacity (e.g., a 10-person conference room that averages 3 occupants)
- Traffic patterns, including which areas see the most movement throughout the day
- Peak usage times, or when spaces hit their highest and lowest occupancy
- Historical trends over weeks, months, or quarters
What it does not capture (when using privacy-first technology):
- Who is in a space (no individual identification)
- When specific people arrive, leave, or take breaks
- Productivity, screen time, or work output
- Audio, video, or images of workspaces
- Anything tied to performance reviews or HR decisions
The output of a well-designed monitoring system looks something like: "Floor 4 averaged 38% utilization last quarter, with peak usage on Tuesdays at 2 p.m." It does not tell you: "Jane spent 47 minutes away from her desk on Wednesday."
Why Organizations Monitor Office Space
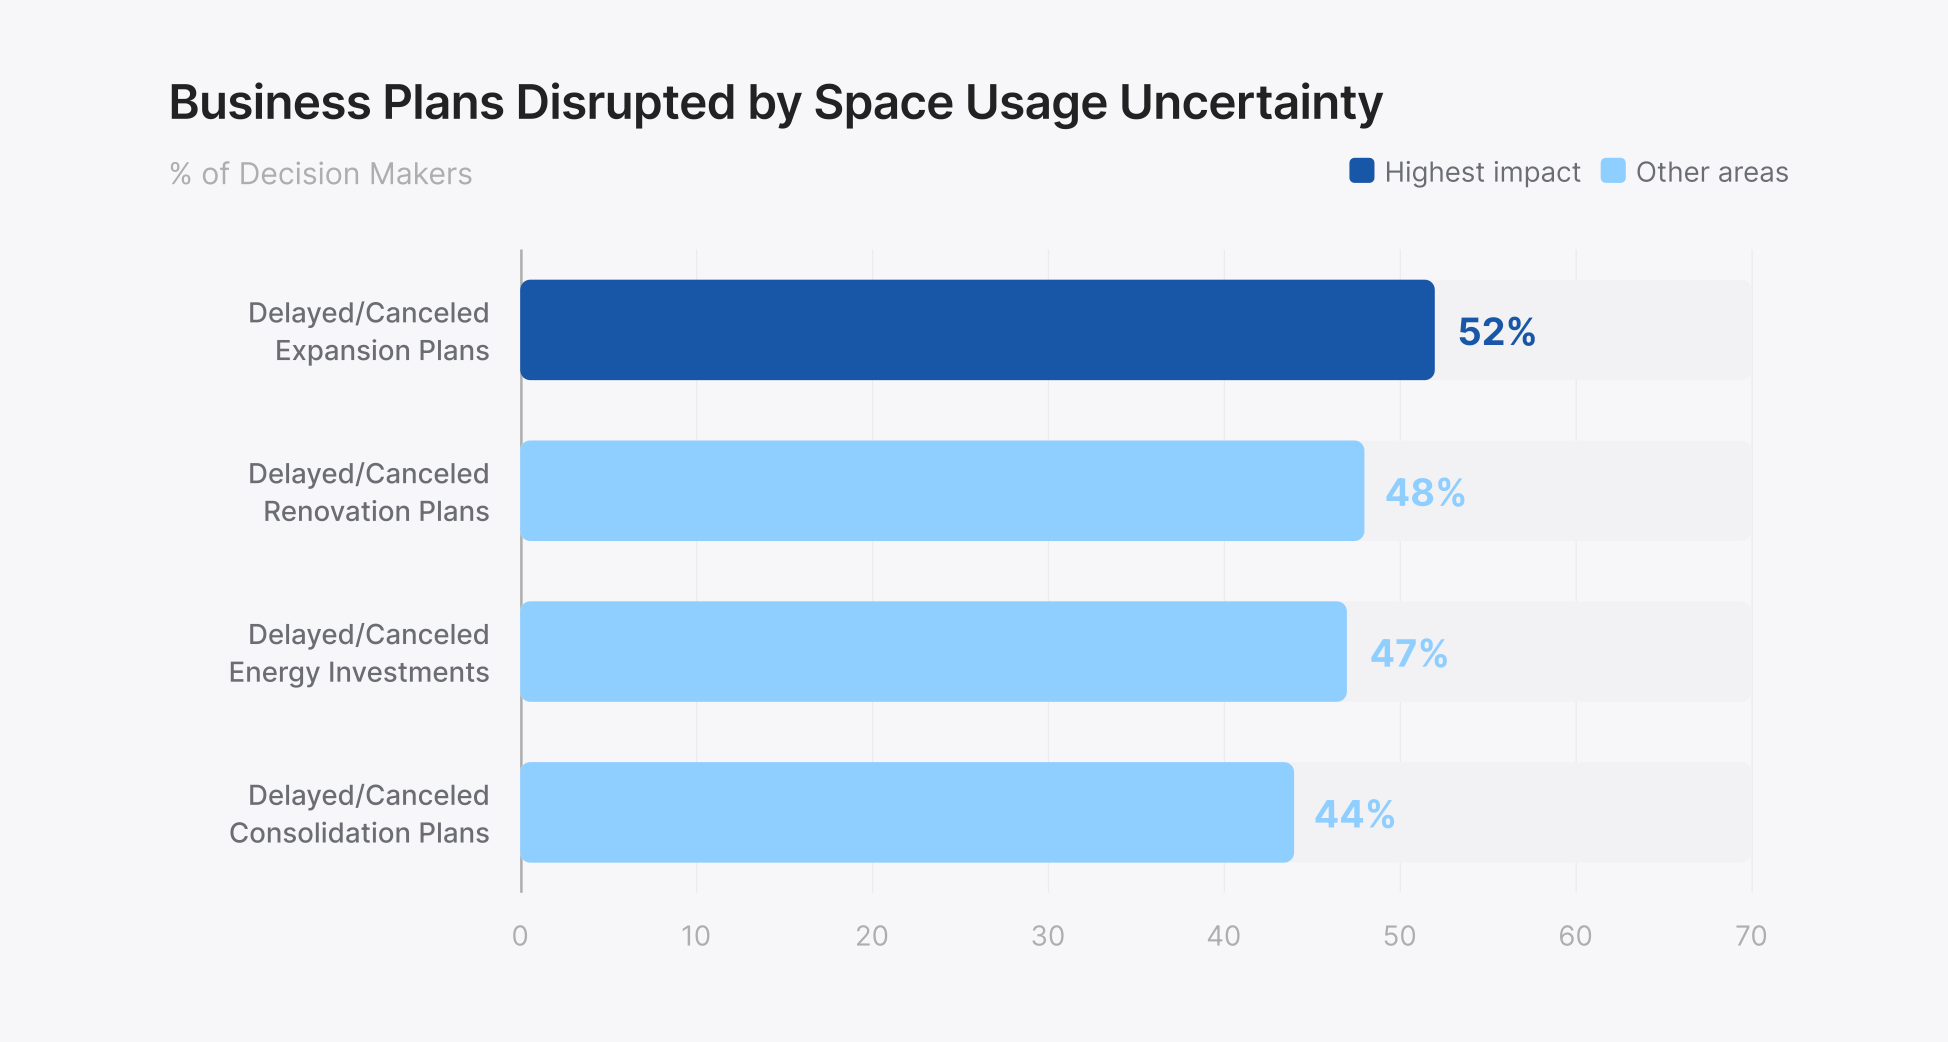
According to Butlr's 2026 State of Office Space Report, a survey of 400 U.S. CRE and facilities decision makers, only 19% report that their space-planning decisions are based mostly on data. More than a third rely primarily on gut instinct.
That gap between available data and actual decision-making has real consequences: 99% of respondents said uncertainty about space usage has disrupted business plans over the past five years, with 52% delaying or canceling expansion plans entirely.
Organizations use space monitoring data to make decisions they'd otherwise be guessing at.
- Portfolio right-sizing. CBRE's 2026 Global Workplace & Occupancy Insights data shows that global average building utilization has reached 53%, up from 38% in 2024 and 35% in 2023. That still means nearly half of office space sits empty on an average day. For organizations with hybrid workforces, the gap between peak and average attendance is even more pronounced. Peak utilization averages 80%, while day-to-day usage lags well behind. Monitoring data gives CRE teams the evidence to consolidate floors, renegotiate leases, or reconfigure layouts based on observed behavior rather than headcount projections.
- Hybrid policy design. A growing number of organizations now expect employees in the office three or more days per week, but whether that's actually happening varies widely. CBRE's research shows Tuesday has become the dominant in-office day, with 73% of organizations reporting it as their peak. Without utilization data, workplace teams are designing policies around assumptions. With it, they can see whether their hybrid model is producing the collaboration patterns leadership intended or creating an office that's overcrowded two days a week and empty the other three.
- Demand-based operations. Cleaning, HVAC, and lighting can be triggered by actual occupancy rather than fixed schedules. Butlr's survey found that decision makers estimate an average of 24% of their office space is heated and cooled for nobody in a typical week. Instead of conditioning every floor every night regardless of usage, facilities teams can direct resources where people actually are, reducing waste without reducing service quality in occupied spaces.
- Meeting room optimization. Booking data tells you a room was reserved. It doesn't tell you whether anyone showed up, or whether a 20-person boardroom hosted a two-person call. Monitoring data reveals ghost bookings, chronic over-provisioning, and rooms that are booked as a hedge because employees can't find available space. These patterns are invisible without sensors in the room.
Types of Office Space Monitoring Technology
Monitoring technologies vary widely in what they can and can't do. They fall along a spectrum from most invasive to most anonymous, and where a system sits on that spectrum determines its privacy implications, deployment complexity, and the quality of data it produces.
Camera-Based Systems
Camera-based systems deliver high accuracy but create ongoing compliance risk because the hardware is physically capable of capturing identifiable information regardless of software settings. They also can't be deployed in privacy-sensitive spaces like restrooms or wellness rooms.
Wi-Fi and Bluetooth Tracking
Wi-Fi and Bluetooth tracking leverages existing infrastructure, but accuracy is unreliable. Not all occupants carry detectable devices, some carry multiple, and MAC address randomization makes consistent counting difficult. Location precision varies by 3 to 10 meters, ruling out room-level analysis.
Passive Infrared (PIR) Sensors
PIR sensors are the most common sensor type in commercial buildings, primarily used to trigger lighting and HVAC. But they can't count people. One person in a conference room looks the same as eight, and they can't reliably detect stationary occupants.
Thermal Occupancy Sensors
Thermal sensors detect body heat signatures using a low-resolution heat map that distinguishes individual people without capturing any visual information. The sensors capture no camera imagery, no photos, and no personally identifiable information. This privacy protection is built into the hardware itself, not controlled by a software setting that could be changed later.
Thermal sensors can also be deployed in spaces where cameras can't go, such as restrooms, wellness rooms, and healthcare environments, eliminating the blind spots that plague camera-based systems.
Butlr is one example of this approach in practice, pairing 95%+ headcount accuracy with zero PII collection, battery-powered installation, and an API-first platform that feeds into existing workflows. Learn more about Butlr here.
Badge and Access Control Data
Badge systems capture entry and exit at access points and are useful for general attendance trends. But they can't tell you where people went once inside. Two hundred badge swipes on a Monday morning might mean Floor 3 is packed while Floor 7 sits empty. Badge data answers "how many entered" but not "how is the space being used."
Common Myths About Office Space Monitoring
Even when the technology is privacy-first, the phrase "office monitoring" raises predictable concerns. Three come up repeatedly.
Myth #1: "They're Watching Us"
The word "monitoring" conjures images of security cameras and someone reviewing footage in a back room. But most modern occupancy monitoring systems don't work that way.
Thermal sensing technology detects body heat signatures only. It cannot identify faces, clothing, devices, or any personal characteristics. The output is a count ("4 people are in Room 302 right now"), not a feed, not an image, not a recording.
Myth #2: "This Data Will Be Used Against Employees"
Employees worry that monitoring data feeds into performance management, that someone is checking whether you were at your desk at 9 a.m. or tracking how long your lunch break lasted.
Space utilization data doesn't answer those questions. It answers questions like: "Do we need this floor?" or "Should we convert the large conference rooms on 6 into smaller huddle spaces?" As described above, anonymous sensing technology cannot tie data to individuals.
A facility team looking at a dashboard sees that Conference Room B averaged 2.3 occupants across a 12-person capacity last quarter. They don't see, and can't see, who those occupants were.
Myth #3: "Monitoring Erodes Workplace Trust"
This concern has real weight. Poorly implemented monitoring absolutely can damage trust. A company that installs cameras without telling employees, or that uses vague language about "workplace analytics" without explaining what data is actually collected, is going to create resentment.
But Butlr's 2026 survey found that 92% of decision makers say privacy considerations are a barrier to getting the space-utilization data they need, which means most organizations are already thinking carefully about this tension. Anonymous sensing technology gives them a clear advantage in the conversation: they can tell employees, honestly, "We cannot identify you. We only know how many people are in a space, not who they are."
When employees understand that monitoring data leads to fewer overcrowded meeting rooms, better climate control, and office layouts that match how people actually work, resistance tends to give way to support.
What to Look for When Choosing a Solution
The technology categories above aren't interchangeable. Each one performs differently across the criteria that matter most for enterprise deployment.
Privacy. Does the system capture any PII? Can it pass legal, IT, and works council review? And is privacy built into the hardware, or is it a software setting that could be changed?
- Strongest: Thermal sensors (no PII by design, physically unable to capture images or identify individuals).
- Weakest: Cameras (video capture triggers extensive legal review) and Wi-Fi/Bluetooth (tracks personal devices that can be linked to individuals).
Accuracy. The difference between counting people and detecting presence matters. For right-sizing, room optimization, and demand-based operations, headcount accuracy is foundational.
- Strongest: Cameras and thermal sensors (both deliver reliable people-counting across room sizes).
- Weakest: PIR sensors (detect motion, can't distinguish one person from five) and badge data (building-level entry counts only, no room-level granularity).
Scalability and deployment speed. Deployment timelines differ significantly by technology. How long does it take to go from pilot to full portfolio?
- Strongest: Thermal sensors (wireless and battery-powered, no electrician, portfolio-wide rollouts in weeks) and PIR (simple, low-cost install).
- Weakest: Cameras (hardwired power and network connections turn multi-building deployments into multi-quarter projects).
Integration. Can the data feed into existing platforms via API, or is it locked behind a proprietary dashboard?
- Strongest: Thermal sensors with open APIs (designed to connect directly to IWMS, BMS, and BI tools).
- Weakest: Closed-dashboard solutions (silo data in proprietary tools, require manual exports to be actionable).
Total cost of ownership. Per-unit sensor cost is one input, but installation labor, electrician fees, network infrastructure, and maintenance cycles all contribute.
- Strongest: Thermal sensors and PIR (no cabling or infrastructure changes, scale without added overhead).
- Weakest: Cameras (high installation costs compounded by wiring, electrician time, and ongoing storage and processing expenses).
Thermal sensors lead on most of these criteria, which is why they've become the default for organizations that need accurate, privacy-compliant utilization data without a lengthy rollout.
Butlr's platform is SOC 2 Type II certified, deploys across full portfolios in weeks, and connects to the BMS, IWMS, and BI tools your team already runs on. Request a demo to see how it maps to your space.
%20(1).png)

.png)
.png)
.webp)

Contact
Let’s create your next big project together.
Subscribe to our newsletter
Oops! Something went wrong while submitting the form.
West Coast, US
800 Airport Blvd
Burlingame, CA 94010
East Coast, US
501 Mass Ave
Cambridge, MA 02139
Japan
CIC, 1 Chome-17-1 Toranomon,
Minato City, Tokyo 105-6415
