

.svg)


6 Best Solutions for Data Center Temperature Monitoring
Handheld thermal scans, point sensors at rack inlets, and server telemetry from IPMI cover the basics of data center temperature monitoring. Most facilities have at least one of these in place, and for tracking ambient air conditions, they work.
The issue is that most thermal faults don't start in ambient air. They develop at specific connections along the power path like busway tap-offs that loosen through thermal cycling, PDU receptacles where resistance climbs gradually, or joints that run a little hotter each month. A point sensor a foot away won't register that kind of fault, and a handheld scan only catches it if someone happens to be scanning at that moment.
It helps to think about temperature monitoring in a data center as covering three distinct targets:
- Ambient air (hot aisle/cold aisle temperatures, ASHRAE compliance)
- Rack-level hardware (server component temps reported through built-in telemetry)
- Power path infrastructure (RPP, busway, PDU connections, and the joints between them)
Most monitoring setups cover the first two. Few cover the third. And with AI and high-density compute pushing denser, less predictable heat loads across racks and zones, the disconnect between what's monitored and what actually fails is getting wider.
This guide compares five monitoring methods side by side, with an honest look at what each one covers, how it deploys, and where it falls short. We also walk through how to set up thermal alerts that give your team enough lead time to intervene before a trending connection turns into downtime.
Here’s a quick overview of what we’ll cover below:
Handheld IR Thermography
A technician walks the data hall with a handheld infrared camera (FLIR or similar), scanning equipment surfaces while components are under load. This is the traditional baseline approach, typically scheduled quarterly, semi-annually, or annually.
What it monitors: Wide-area surface temperatures across panels, switchgear, busway, PDUs, and cooling infrastructure. Can cover the power path if the technician specifically targets those components during the scan, though coverage depends entirely on what's included in the scan route.
Coverage: Periodic. Only captures conditions at the moment the technician is present.
Deployment complexity: Low. No permanent installation required. Uses existing handheld IR camera equipment but requires a trained, certified thermographer. Safety considerations apply when scanning near energized equipment, including PPE requirements, arc flash risk, and sometimes the need to open panel doors.
Trade-offs:
A fault that develops between scans goes undetected until the next scheduled visit. For a connection that's slowly climbing in resistance over weeks, quarterly scans leave long windows of exposure.
Handheld IR also can't show trends over time unless scan data is carefully archived and compared across visits, which rarely happens in practice. Most facilities use handheld scans for targeted troubleshooting and post-incident investigation. As a standalone prevention strategy, the gaps are hard to ignore.
Best for: Targeted troubleshooting, post-incident analysis, and establishing a baseline thermal profile. Limited as a primary fault-prevention approach because of the gaps between scan windows.
Point Sensors (Wired and Wireless IoT)
Individual temperature probes (thermocouples, RTDs, or thermistors) installed at fixed positions throughout the facility, reporting continuously to a monitoring platform. This is the most common permanent monitoring approach in data centers today.
ASHRAE recommends six sensors per rack (top, middle, and bottom of both the front and back) for thorough ambient coverage, which gives a sense of the density required for full-coverage monitoring.
What it monitors: Ambient air temperature at fixed points, including rack inlets, rack outlets, aisle positions, and cooling unit supply and return air. This makes point sensors strong for ASHRAE compliance and hot/cold aisle monitoring, the first of the three monitoring targets.
Coverage: Continuous, but only at the exact point where each sensor is placed. A hot connection 12 inches from a sensor may not register.
Deployment complexity: Medium. Wired sensors require cabling runs that can be disruptive in live facilities. Wireless sensors (from vendors like Monnit, Sensaphone, AKCP, ControlByWeb, and E-Control Systems) simplify installation but introduce battery management and gateway infrastructure.
For smaller setups or budget-conscious deployments, USB-based probes like TEMPer plug directly into a server's USB port and log temperature with minimal setup, though they're limited to a single point per unit and tied to the host machine.
Trade-offs:
Wired deployments can be disruptive to retrofit in a live facility, while wireless deployments trade cabling for battery replacement cycles and gateway management.
For power path monitoring, point sensors would need to be placed directly on each connection, which creates a cost-per-point challenge across large facilities. A facility with hundreds of busway tap-offs and PDU connections would need hundreds of individual sensors to cover the power path, each one measuring only its own location.
Best for: Ambient environmental compliance and ASHRAE-aligned monitoring. Strong for the ambient air target, limited for power path coverage unless deployed at very high density.
Thermal Sensor Arrays
Grid-based thermal sensing that covers the power path end to end, from the RPP through overhead busway tap-offs, the whip, and the rack PDU (inlet, receptacles, and busbar joints). The arrays detect rising thermal trends at specific connections continuously and catch faults that develop gradually over weeks or months.
What it monitors: Connection-level thermal behavior across the full power distribution chain, plus white-space and above-rack zones where server telemetry has no visibility. This is the monitoring target that most other methods miss.
Coverage: Continuous. Full power path from RPP to rack PDU.
Deployment complexity: Low to medium. Wireless for white-space monitoring, wired where it matters. No hall shutdown required for installation. A team can deploy sensors and begin capturing data within days, not months.
Trade-offs:
This is a newer category than point sensors or handheld IR, so there are fewer legacy installations to reference against. Thermal sensor arrays are strongest for power distribution fault detection and thermal trend monitoring.
They're not designed for ambient air compliance, so facilities that need ASHRAE-aligned inlet temperature monitoring will still want point sensors or server telemetry for that layer.
The key advantage is catching the faults that other methods miss. A busway joint trending upward by a few degrees over weeks is exactly the kind of fault that handheld scans miss between visits and point sensors miss between locations. Continuous array coverage catches it.
No cameras, no images, no PII. The sensors produce purely thermal data, which avoids restrictions on imaging equipment inside secure data halls.
Best for: Power path fault detection across the full distribution chain. Particularly valuable in facilities where long intervals between handheld scans represent the biggest unmonitored risk.
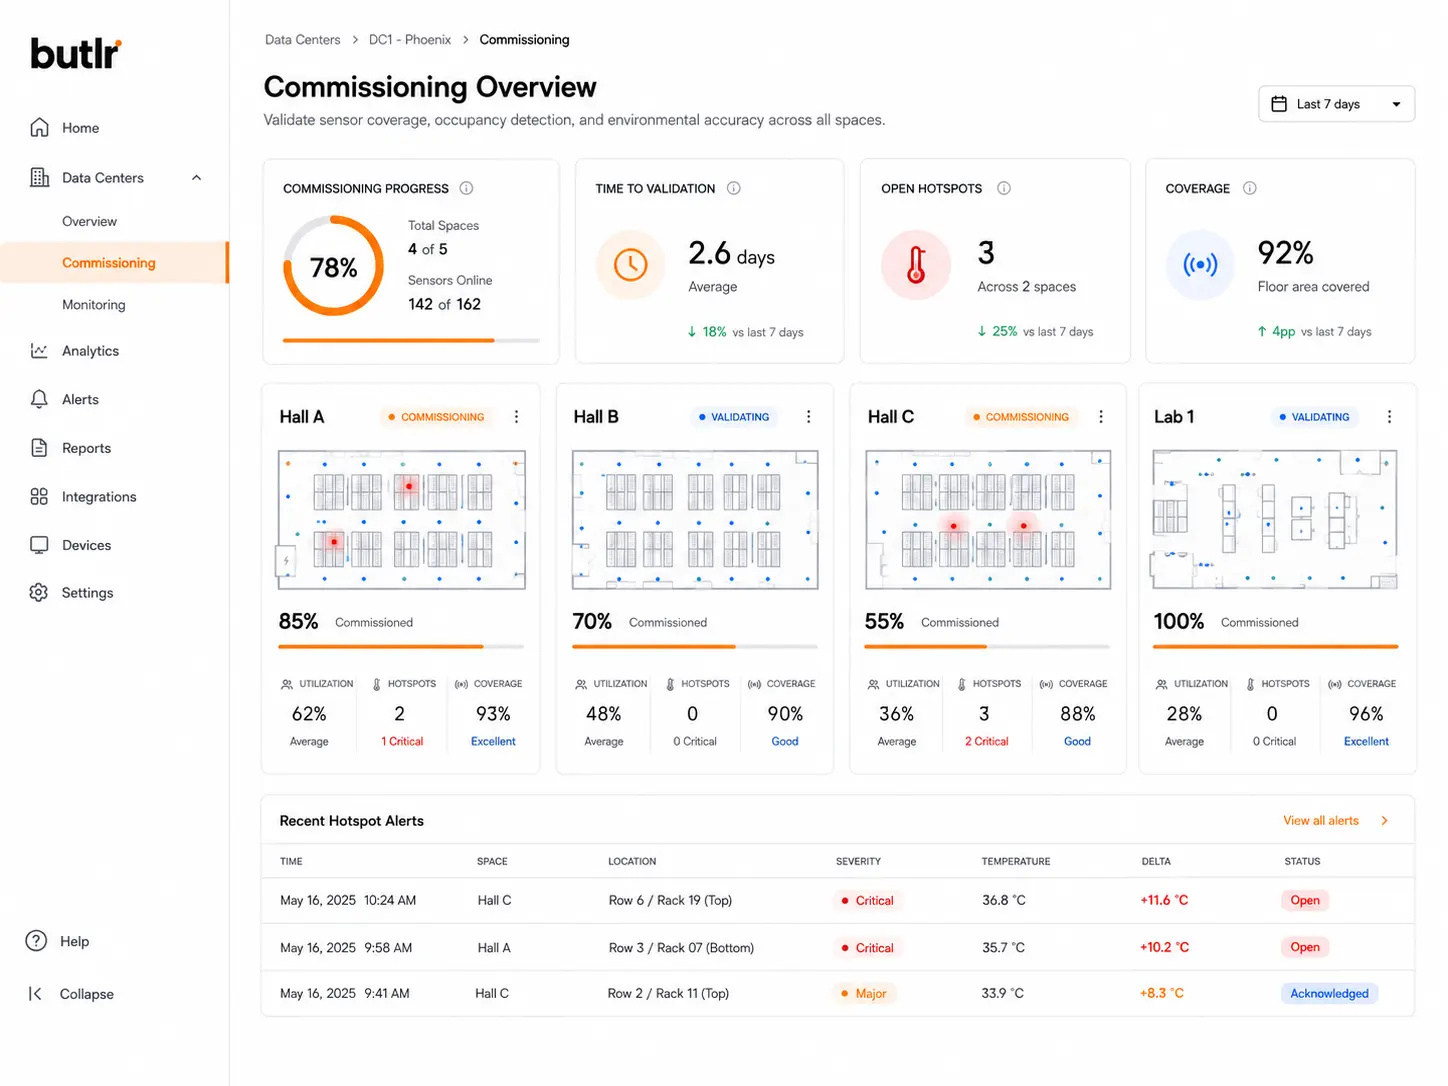
For example, Butlr's data center solution uses this approach. Wireless, battery-powered sensors deploy without an electrician or a hall shutdown, with alerts routed into existing NOC dashboards and ticketing systems via API.
Learn more about Butlr's data center solution.
Server-Level Telemetry (IPMI/BMC)
Temperature sensors built into server hardware report CPU, inlet air, and component-level temperatures via IPMI, Redfish, or BMC interfaces. This data is already available at no additional hardware cost in virtually all enterprise servers.
What it monitors: Internal server component temperatures (CPU, memory, storage, ambient inlet). Some platforms also report fan speeds, power draw, and thermal throttling status. This covers the rack-level hardware target thoroughly.
Coverage: Continuous, per-server.
Deployment complexity: Low. Built into the hardware. Requires software configuration to aggregate data across servers and forward it to a central monitoring platform, but no additional sensors or cabling.
Trade-offs:
Server telemetry has no visibility into the power path, busway, or rack-level infrastructure upstream of the server. A server could report normal inlet temperatures while the PDU connection feeding it is steadily climbing toward failure.
Power path faults don't always show up as server-level temperature changes until the fault is well advanced. By the time inlet air temperature rises enough to trigger a server-level alert, the connection that caused it may already be at risk of failure.
Best for: Monitoring internal server health and component temperatures. Useful as one data layer in a broader monitoring strategy. Insufficient as the sole approach because it can't see anything upstream of the server chassis.
Fixed-Mount Thermal Cameras
Permanently installed infrared cameras that provide continuous thermal imaging of equipment within their field of view, 24/7. A fault that develops overnight or between visits gets captured automatically. Vendors in this space include Movitherm and Sytis.
What it monitors: Surface temperatures across whatever equipment falls within the camera's field of view. Can cover power distribution equipment, switchgear, and rack infrastructure if cameras are positioned accordingly.
Coverage: Continuous within each camera's field of view. Gaps exist between cameras unless enough units are installed for full overlap, which drives up cost and complexity quickly.
Deployment complexity: Medium to high. Each camera requires mounting, power, and network connectivity. Full-facility coverage requires multiple units, and each one needs to be aimed, calibrated, and maintained.
Trade-offs:
Fixed-mount thermal cameras can generate visual thermal records for trend analysis and historical review, which is useful for both maintenance planning and post-incident investigation.
The main constraint for many data center operators is that these cameras create a visual record inside the facility. In colocation environments, government data centers, and financial services facilities, imaging equipment is often restricted or prohibited by security policy.
The cameras produce thermal data only, with no visible-light video, but any imaging hardware in the data hall may still conflict with tenant agreements or compliance requirements.
Per-point cost is also higher than point sensors, and the system requires ongoing camera maintenance and periodic recalibration.
Best for: Facilities where continuous visual thermal records add value and security policies permit imaging equipment in the data hall. Less practical in multi-tenant, government, or financial services environments with restrictions on imaging hardware.
How to Set Up Data Center Thermal Alerts
The difference between a well-tuned alerting system and one that gets ignored depends on four factors.
Set Per-Zone Thresholds, Not Facility-Wide Thresholds
Load distribution across a data center is rarely uniform. A temperature that's normal in one zone may signal a problem in another. Baseline each zone before setting thresholds rather than applying a single set of values across the entire facility.
ASHRAE recommends inlet temperatures between 18-27°C (64-81°F), but that guidance applies to ambient air. Power path connections need different threshold logic entirely. A busway joint trending upward by a few degrees over weeks may indicate a bigger problem than a rack inlet that temporarily spikes during a cooling transition. Static thresholds based on absolute temperature values miss these slow-moving trends.
Route Alerts to Existing Systems
Send notifications to the tools your operations team already watches, such as NOC dashboards, ticketing platforms, and mobile notifications. Requiring operators to check a separate monitoring console for thermal data creates a gap between detection and response.
Integration with BMS and building automation systems can also let thermal alerts trigger automated cooling responses and shorten the window between detection and action.
Define Escalation Tiers
Not every alert requires the same response. A three-tier approach gives operators context instead of treating every notification as equally urgent:
- Informational alerts for trending conditions (gradual temperature climb over days or weeks)
- Immediate alerts for threshold breaches (temperature exceeds zone-specific limits)
- Critical alerts for rapid thermal excursions (sudden spike that suggests active failure)
This structure ensures that trending conditions get logged and reviewed without creating the urgency fatigue that comes from treating every alert as critical.
Guard Against Alert Fatigue
Poorly tuned thresholds generate noise that trains operators to ignore alerts entirely. This is arguably worse than no alerting at all, because the team develops a habit of dismissing notifications.
Trend-based alerts (a connection that has climbed 3°C over two weeks) often catch developing faults earlier and with fewer false positives than static threshold alerts alone. The goal is to surface the conditions that actually require intervention and filter out the ones that don't.
Beyond Fault Detection: Thermal Data and Cooling Efficiency
Continuous thermal data also changes how facilities approach cooling.
Most data centers cool to worst-case assumptions, conditioning the entire hall uniformly regardless of where heat loads actually concentrate. With continuous thermal monitoring, operators can match energy use to where the hall actually runs hot, measured in real time.
If thermal data shows that rows 1 through 4 consistently run 5°C cooler than rows 8 through 12, operators can shift cooling capacity toward the hotter zone instead of overcooling the entire hall to keep up with its warmest rows. Cooling output follows actual demand across zones.
As part of a broader efficiency strategy, this kind of spatial intelligence can reduce energy demand by 20-30%. For facilities where energy costs are a growing share of operating expenses, that's a meaningful operational improvement backed by measured data rather than modeled projections.
For organizations evaluating continuous thermal monitoring for data center power paths, Butlr's camera-free thermal sensors and API-first platform are designed for fast deployment without hall shutdowns. Learn more about Butlr's data center solution.
.png)

%20(1).png)
.png)
.webp)