


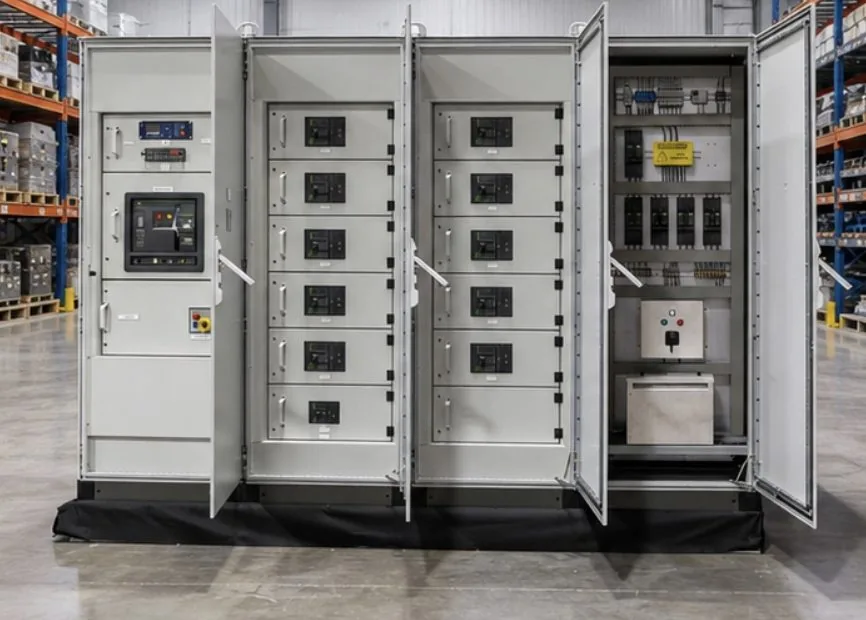
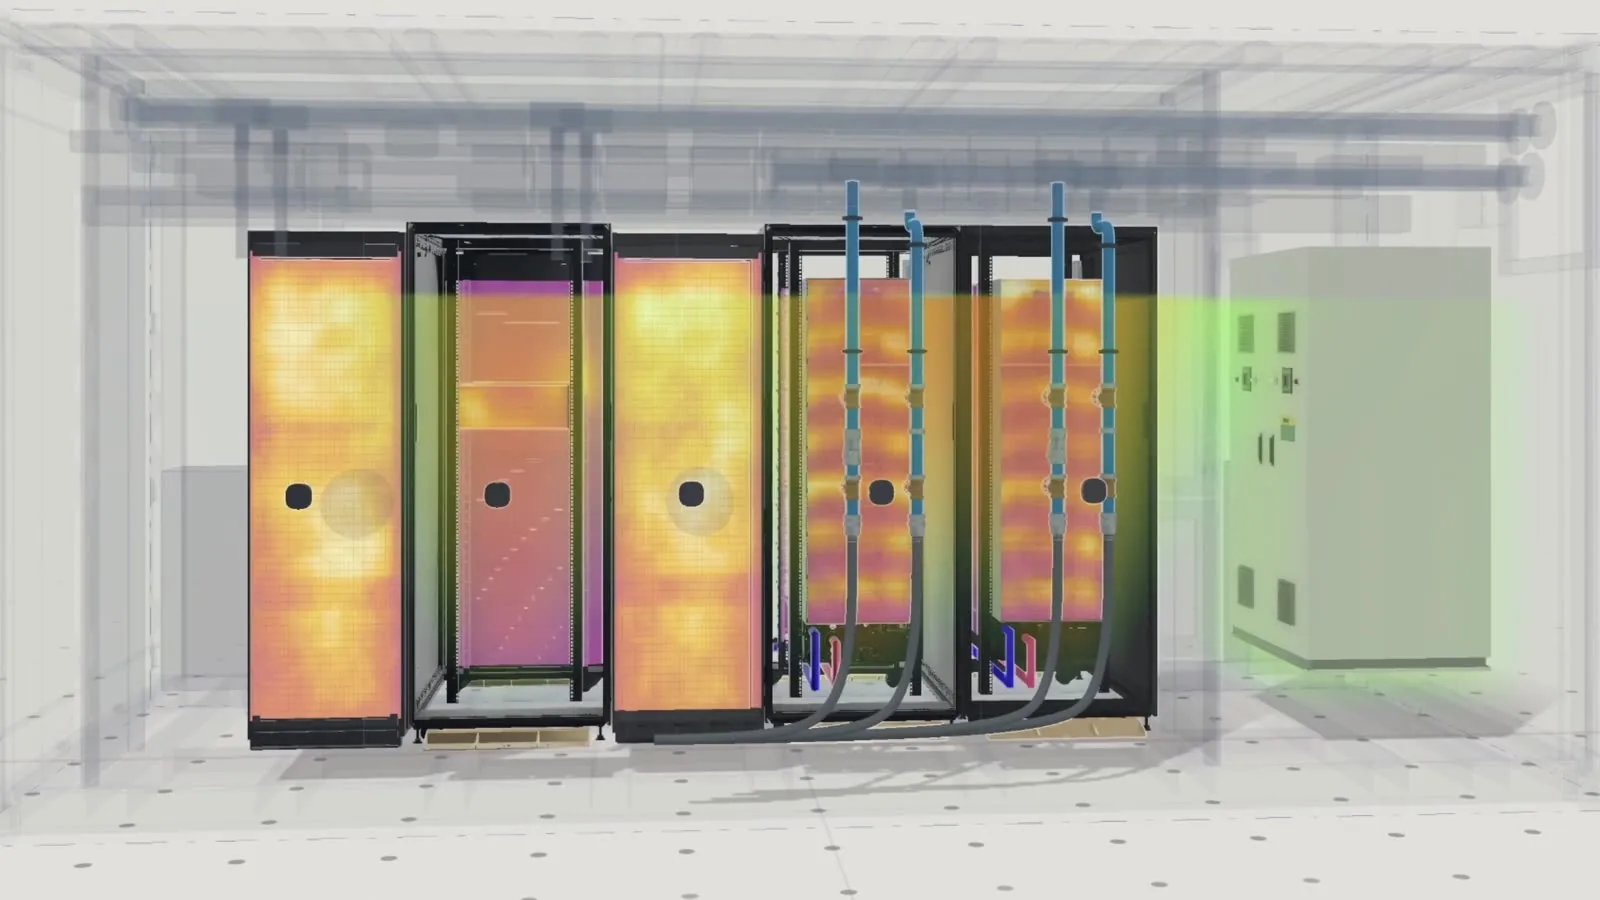
Power cabinet and RPP monitoring
Continuous thermal monitoring of the breaker and switchgear connections inside your power cabinets and remote power panels. Every day, not once a year.
- CB-10 · Lug A31.2°C
- CB-12 · Lug A30.8°C
- CB-14 · Lug B[TEMP] · rising
- CB-16 · Lug A31.5°C
- CB-18 · Lug C30.9°C
A loose connection doesn't trip anything. It just gets hotter.
Breakers protect against overcurrent. They have no way to notice a lug that's slowly working loose.
Resistance creeps up
Thermal cycling, vibration and oxidation loosen terminations a little at a time. Resistance at the joint climbs with them.
Heat scales with load
Heat at a connection rises with the square of the current. High-density AI loads turn a small resistance change into a real hotspot.
Nothing alerts
No breaker trips and no fuse blows. The first sign is often discoloration, a failure, or a fire.
What a once-a-year scan can't tell you
Infrared surveys are good practice. They're also a snapshot of one day, under one load.
| Criteria | Annual infrared scan | Butlr continuous monitoring |
|---|---|---|
| How often | Once a year | Every day, around the clock |
| What you learn | Temperature at one moment | Trend against each connection's own baseline |
| Load conditions | Whatever the load was that day | Compared across real load patterns |
| Access | Panel opened, technician on site | Sensors stay installed in the cabinet |
How it works
- 1
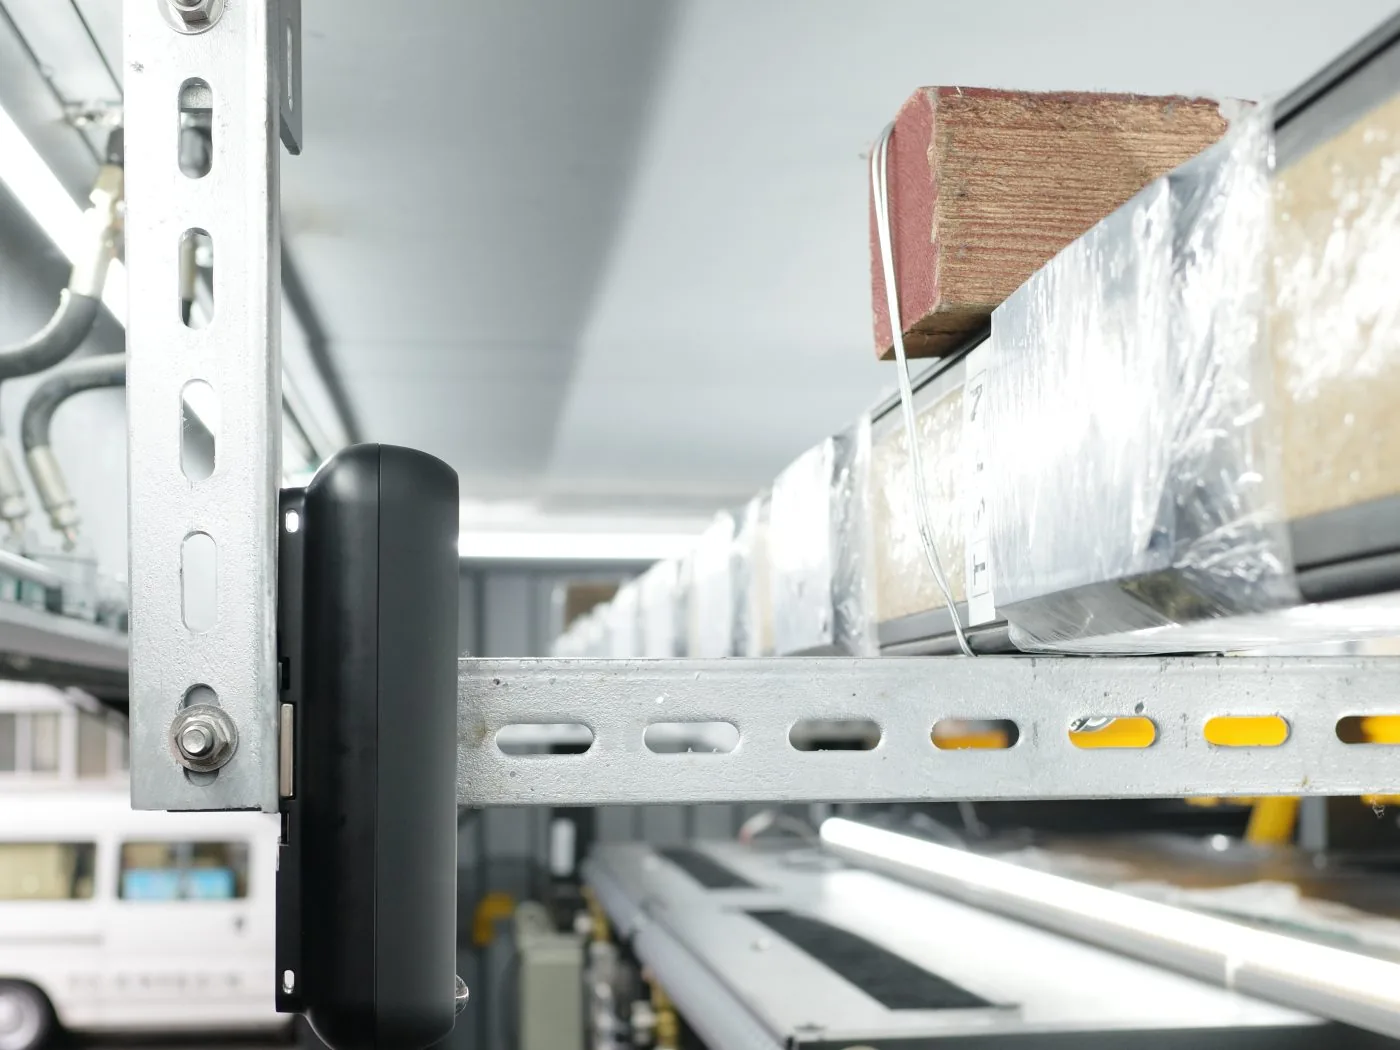
Mount inside the cabinet
A battery-powered thermal sensor watches the breaker and switchgear connections. No wiring, no shutdown. - 2
Learn each connection's normal
The Butlr Platform builds a baseline per connection, so a joint running warmer than it used to stands out. - 3
Alert on drift, not just thresholds
A connection climbing a few degrees over two weeks never crosses a static limit. Butlr flags the trend.
Alerts where your team already works
Per-zone thresholds route to the tools your facilities and critical-environment teams already use. Open APIs feed your DCIM, BMS and digital twin.
Built with partners



See what's happening inside your cabinets
We'll walk through placement, alerting and integration for your facility.