

.svg)


How to Choose Occupancy Sensors for Classrooms
Classrooms are one of the most common spaces where universities want to measure occupancy. But they're one of the hardest to measure accurately.
The biggest issue is that students sit still for extended periods, which is the opposite of what most sensors are designed to detect. Tiered seating in lecture halls adds blind spots, and room sizes that range from 400-square-foot seminar rooms to 300-seat auditoriums mean a single sensor setup rarely works across a full campus.
Most occupancy sensors were designed for offices and corridors where people move frequently. So a sensor that works well in a hallway or open-plan workspace may badly undercount in a classroom setting.
This guide covers what makes classrooms a distinct sensing environment, how the major sensor technologies perform under those conditions, and what to evaluate before choosing a solution for your campus.
Why Classrooms Are a Difficult Environment for Occupancy Sensors
Classrooms present conditions that most occupancy sensors struggle with.
Seated Stillness
In practice, many conventional occupancy sensors are motion sensors, a design inherited from lighting control, so they treat movement as evidence of presence.
Classrooms expose that weakness. Passive infrared (PIR) sensors show this most clearly because they register only the changes in infrared radiation that movement creates.
For example, a student taking notes may move a hand and little else. One taking an exam may not appear to move at all for 60 to 75 minutes. So if the lights in a lecture hall shut off mid-class until someone waves an arm at the ceiling, the sensor has judged a full room to be empty.
For lighting, a dark lecture hall is an annoyance. But for space planning, the same misjudgment can easily corrupt the data. For example, a sensor might log a room as unused during a session that multiple students attended. From there, a registrar reading that data could conclude the room is free for scheduling, or worse, that the building has excess capacity it doesn't have.
Room Geometry and Layout Variability
Campus building stock typically spans decades, with classroom design differing by era. For instance, a single campus might have a 1965 auditorium with fixed tiered seating, a 1990s flat classroom filled with tablet-arm desks, and a newly renovated active-learning space with movable furniture. A sensor configuration tuned for any one of those rooms can miss badly in the other two.
Of the three, tiered seating tends to be the most challenging. Each riser puts occupants at a different distance and angle from a ceiling-mounted sensor. In addition, the rows themselves can block sightlines. A sensor aimed at the front of the hall may never get a clean read on the back third.
Meanwhile, mounting height involves a trade-off of its own. A sensor's field of view widens as the ceiling gets taller. But each person in that wider view returns a smaller and fainter signal.
In practice, a device that counts reliably from a 9-foot seminar room ceiling may struggle at 22 feet above an auditorium floor. Ask vendors for tested performance at height rather than coverage area alone.
Environmental Interference
Stillness often makes motion-based sensors undercount. Building systems can create the opposite problem. Suppose a rooftop unit kicks on and a diffuser pushes warm air across an empty room. A sensor that can't separate mechanical heat from body heat may log occupants who were never there.
Sunlight can produce the same false positives, just on a slower cycle. A south-facing classroom can warm unevenly through the afternoon as direct sun heats desks and seatbacks near the windows. As the resulting temperature gradients drift across the sensor's view, they can register as phantom occupancy.
These two errors can also obscure each other. Undercounting from stillness and overcounting from interference can partially cancel in aggregate reports. Campus-wide numbers may look plausible while individual room counts remain wrong.
To guard against both, ask vendors how their system filters mechanical and solar heat. Check readings against manual headcounts during any pilot.
How Different Sensor Technologies Perform in Classrooms
No major sensing technology leads on all criteria that determine classroom performance. Each one trades detection accuracy, coverage, privacy, or installation effort against the others.
Key Trade-Offs to Weigh
PIR and ultrasonic sensors cost the least and have decades of installed history. But because both were built for lighting control, they report occupied or vacant and nothing more.
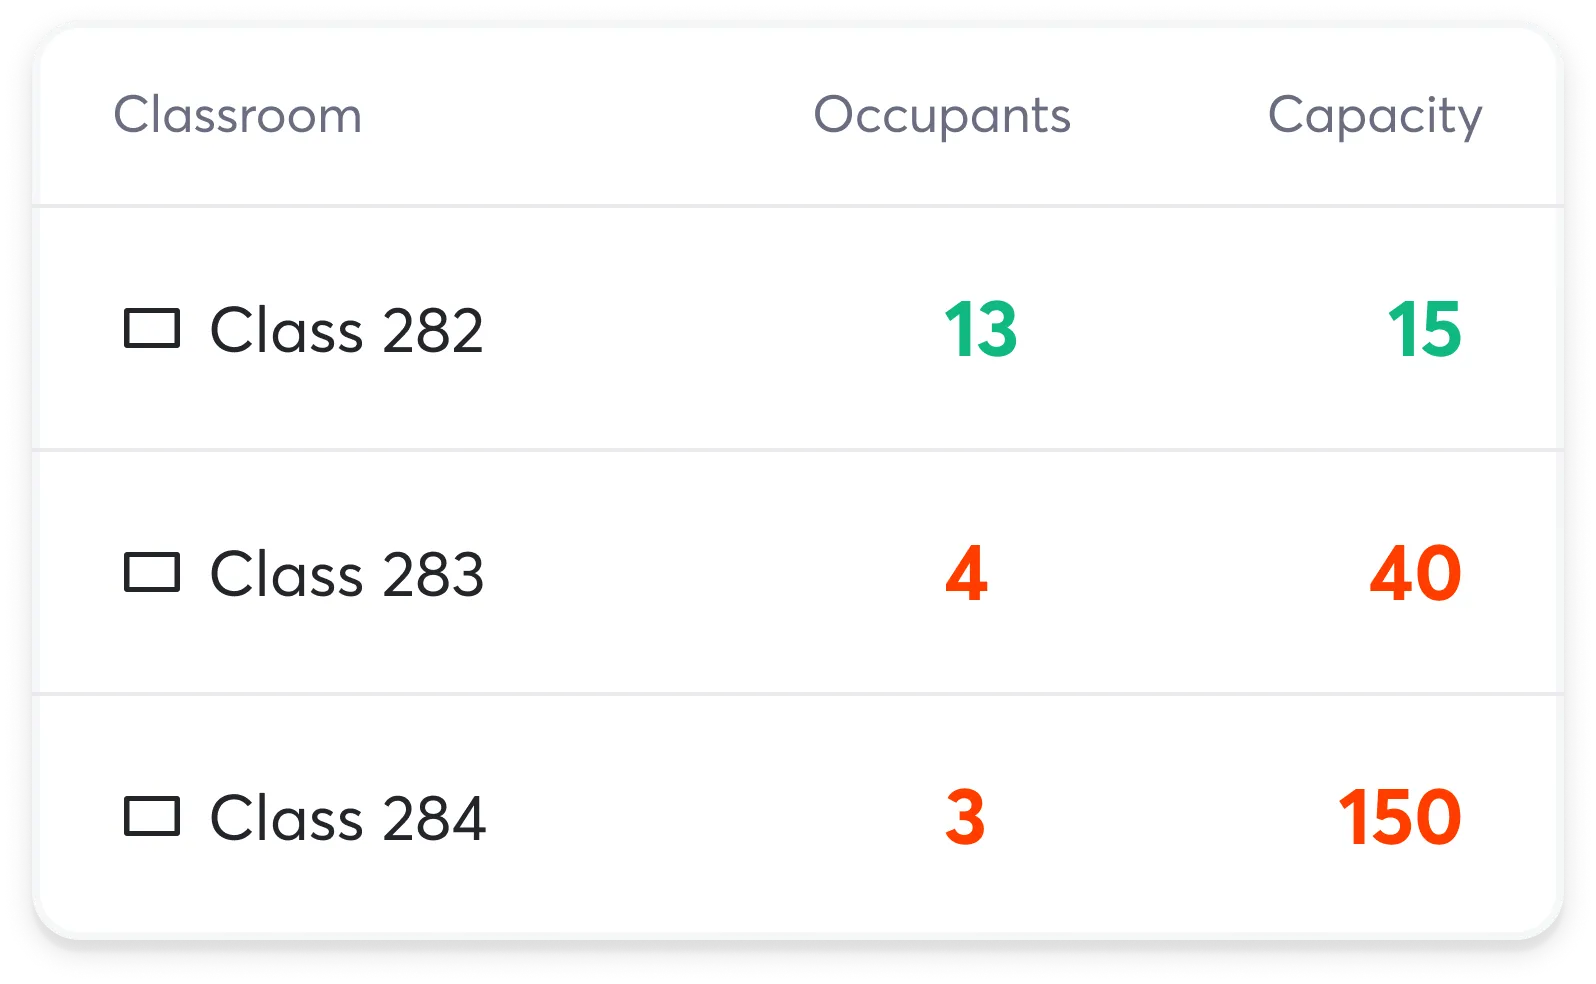
Binary data can't distinguish five students in a 150-seat hall from a full house. Yet seat fill is usually the number a registrar needs. A sensor network that can't produce that data may help you save on hardware while failing to support the decisions that justified the project.
Camera-based systems deliver the granularity that space planners want, but their hardware can create its own approval burden. After all, a camera aimed at students tends to invite review from IT security, legal, and even student government.
Even anonymized edge processing doesn't always settle those concerns, as the raw capture capability still exists. A camera system can win the spec comparison but lose the project to a technology that clears review faster.
Wi-Fi and Bluetooth positioning look attractive because the access points are already on the ceiling. The main issue is the unit of measurement.
Say a student brings a laptop, phone, and smartwatch to class while a classmate leaves their own devices in the dorm. In that room, the count would read three people when two are present. Calibration can correct the average ratio over time. But device habits tend to shift across a semester, so the correction drifts too.
Thermal sensing reads body heat instead of motion, which directly addresses seated stillness. This technology also sidesteps the two trade-offs above, as heat signatures contain no images to review or devices to miscount.
If you're evaluating sensors for classrooms or other campus spaces, Butlr's team can walk you through how thermal sensing handles these specific challenges. Learn more about Butlr here.
What Data to Expect and How It Reaches Your Systems
Sensor evaluations tend to focus on the hardware, but the data pipeline determines whether anyone benefits. Before comparing devices, work out which outputs your teams need and how those outputs will reach the systems they already use.
Data Outputs to Ask For
Vendors describe their outputs in different terms, but the data generally falls into five buckets:
- Headcount: This is the number of people in the room at a given moment, and it forms the basis of seat fill analysis. For example, a 40-person reading in a 150-seat hall translates to a 27% fill rate that a registrar can act on.
- Presence and Vacancy: Presence data shows whether the room is occupied at all. It works well for lighting and HVAC automation, but it's too coarse to support space planning on its own.
- Zone-Level Occupancy: Zone data shows where people cluster within the room. It's especially relevant in large lecture halls, where a half-full session packed into the back rows tells a different story than one spread evenly across the seats.
- Dwell Time: Dwell time measures how long occupants stay in a space. This data differentiates a room people briefly pass through from one that's in active use.
- Historical Trends: Trend data reveals patterns across weeks and semesters, the foundation of campus occupancy analytics. This is the evidence registrars and space planners typically need before changing schedules or making capital decisions.
Integration Architecture
The most flexible systems expose data through a REST API or webhooks, letting teams pull occupancy information into their own tools.
This lets facilities feed occupancy into the building management system (BMS) while analysts chart it in Tableau or Power BI. For lighting and HVAC automation that needs real-time signals, some platforms also support direct BMS protocols or MQTT (Message Queuing Telemetry Transport), a lightweight messaging protocol common in building automation.
When evaluating systems, confirm whether the vendor dashboard has to be your primary interface. Ideally, the vendor can provide the infrastructure that works with your existing integrated workplace management system (IWMS) and other tools. A dashboard-only product limits the data to whoever logs in, while an API-first product lets each department keep working in the tools it already uses.
Deployment Planning: Coverage by Room Type
Room size and ceiling height drive how many sensors a space needs and where they go. On a typical campus, three classroom types account for much of that variation.
Seminar Rooms (Under 600 Sq Ft)
Seminar rooms typically have 8- to 10-foot ceilings and seat 15 to 25 people. At this scale, a single device can usually cover the full footprint, no matter the technology. Focus the test on seated-stillness detection rather than coverage, since a small room of near-motionless occupants is where motion-based sensing tends to fail first.
Standard Classrooms (600 to 1,200 Sq Ft)
Standard classrooms typically have 8- to 12-foot ceilings and 30 to 60 seats. Depending on the sensor's field of view, one or two devices per room is usually enough. If you're evaluating a new sensor, start here. This tends to be the most common room type on campus, so pilot results translate well to the rest of the portfolio.
Lecture Halls (1,200+ Sq Ft, Tiered Seating)
Lecture halls often pair 15- to 25-foot ceilings with 100 to 300 or more seats. Tiered seating and the greater ceiling-to-occupant distance make coverage harder, so plan on multiple sensors per hall.
When you brief vendors, share your ceiling heights and seating geometry up front. Ask for reference deployments in comparable halls too. Claimed and proven coverage can differ at this scale.
Other Campus Spaces to Consider
Classroom criteria don't always transfer cleanly to every building. Before settling on a sensor standard, check it against the other spaces a campus rollout usually touches.
- Faculty and Staff Offices: Offices are smaller than classrooms, and many hold just one or two people. The main use case is measuring how often the space gets used at all to inform allocation. Desks have the stillness problem, though, so a sensor that fails in classrooms will likely fail here too.
- Labs: Labs bring mechanical noise that other spaces don't. Equipment, fume hoods, and ventilation generate heat and motion that sensors need to filter out. Safety-driven HVAC often runs regardless of occupancy, which limits energy automation. But utilization data still pays off in scheduling and capital planning.
- Student Lounges and Common Areas: Lounges flip the classroom pattern. Turnover is high, furniture moves, and nothing runs on a schedule. Zone-level sensing tends to beat binary room-level presence here.
- Libraries: Libraries behave like classrooms in some zones and lounges in others. Silent study areas reproduce the seated-stillness problem, while group rooms, carrels, and stacks each generate their own usage patterns, so independent zone coverage typically produces the most useful data.
Piloting Before Scaling
The most effective pilots have the potential to fail. Design yours to stress the sensors rather than flatter them. Start with a single building or a set of 10 to 20 rooms that span your range of classroom types, from seminar rooms to at least one lecture hall.
Then run it for a full academic term. Anything shorter misses the add/drop churn period, midterm and finals attendance swings, and the slower shifts in how rooms get used.
And before the first sensor goes up, define what success means. Depending on your criteria, that might mean seat fill accuracy against registrar data, uptime, or clean integration with your existing systems.
How Butlr Addresses These Challenges
Butlr's thermal sensors detect body heat rather than movement, so a student sitting still through an exam registers the same as one walking through the door. This solves the seated stillness problem that causes false vacancy readings in classrooms.
Our sensors are anonymous by hardware design. They capture no images, track no devices, and collect no personally identifiable information. There's no raw data that anyone could reidentify later. This simplifies review by IT, legal, and student governance.
We built our platform API-first. REST APIs and webhooks feed occupancy data into the BMS, IWMS, and BI tools your campus already runs, so the system operates as infrastructure rather than another dashboard.
Our sensors run on batteries and mount to the ceiling, so installation doesn't require an electrician or new wiring. This helps in older buildings where running power is expensive or restricted, so typical deployments go live in weeks.
And because our hardware installs quickly, you can start a pilot in a single classroom building and then scale across campus based on the results. Learn more about how Butlr's thermal sensors work in classroom environments here.
.png)

%20(1).png)
.png)
.webp)