

.svg)

Butlr vs Density: A Head-to-Head Comparison
Butlr and Density are two of the most recognized names in occupancy sensing. Both platforms serve enterprise organizations looking to understand how their spaces are used, and both have earned the trust of large global portfolios. But the similarities between the platforms can make it harder to see where they actually differ.
Density has built its reputation around high-resolution spatial analytics, using 60GHz radar to map movement behavior and a proprietary dashboard to visualize the data. Butlr has focused on building a privacy-first occupancy intelligence layer, using thermal sensing that is physically incapable of capturing identifiable data, paired with an API-first architecture designed to feed insights into the systems organizations already use.
Those are two very different foundations, which lead to variations in deployment speed, privacy compliance, integration flexibility, and total cost of ownership at portfolio scale. This article breaks down those differences category by category, so you can evaluate which platform is actually built for what your building needs.
Butlr Overview
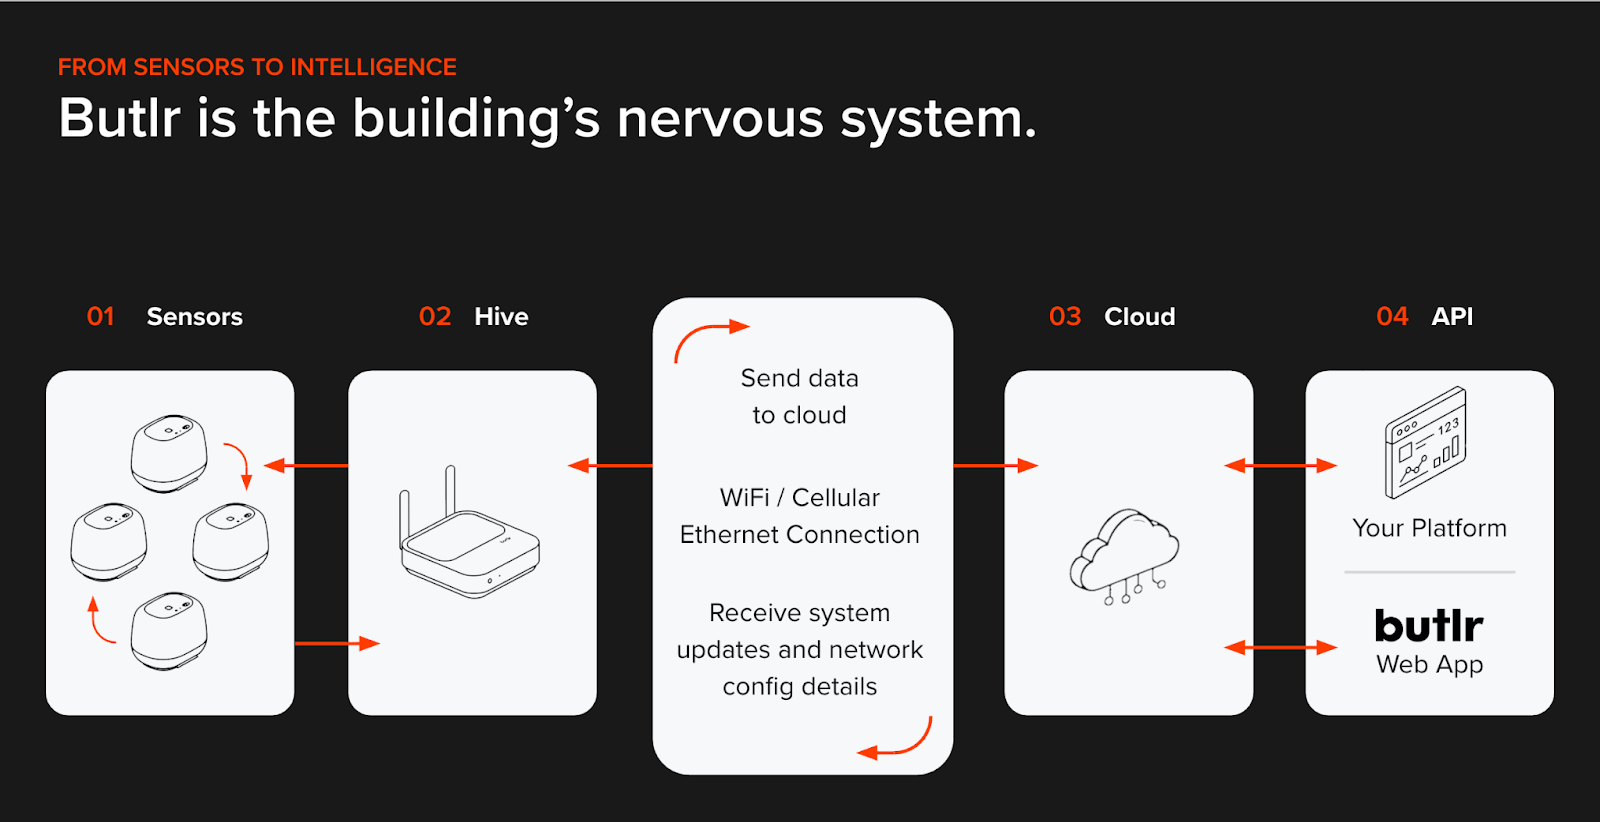
Butlr is a privacy-first occupancy intelligence platform used by global enterprises across 22+ countries, with more than 30,000 sensors covering over 100 million square feet. The platform uses low-resolution thermal sensing and AI-based spatial modeling to detect presence, headcount, movement, and dwell time without ever capturing images, biometric data, or anything that could identify an individual.
Think of it as the building's nervous system: an infrastructure layer that gives buildings a shared, trustworthy understanding of how space is used.
1. Your occupancy data is anonymous at the hardware level
Butlr's sensors capture thermal energy only. They can't produce images, silhouettes, or motion signatures tied to a specific person. They don't capture personally identifiable information (PII), so there's nothing to anonymize after the fact.
This means legal reviews move faster, works councils have fewer objections, and sensitive spaces like restrooms, patient rooms, and labs are fully accessible. For a broader view across both EU and US frameworks, see our compliance checklist for facilities managers.
2. One sensor covers two use cases
A single Butlr sensor supports both presence mode and traffic mode. Presence mode detects the number and location of people within a defined area, while traffic mode counts directional in/out movement across a threshold. That means you can measure room-level utilization and building-level foot traffic without buying or managing different hardware for multiple use cases.
3. Your data syncs with your tech stack
As an API-first platform, Butlr's REST APIs and event-driven webhooks connect directly to integrated workplace management system (IWMS) platforms; building management system (BMS) and HVAC systems; BI tools like Tableau and Power BI, and smart cleaning platforms. The occupancy data lives inside your existing stack, not in a separate dashboard.
4. Deployment takes under a month
Butlr's workplace occupancy sensors are wireless and battery-powered. They're easy to install at scale, without electricians, power drops, or network wiring. You can install hundreds of sensors overnight and start collecting actionable data within three weeks. That speed is a deciding factor if you need occupancy insights next month rather than next quarter.
Advantages
- Privacy approvals are often the longest phase of an occupancy sensor rollout, especially in the EU or in industries like healthcare and finance. Butlr sidesteps that bottleneck entirely because the thermal sensors have no physical ability to capture PII. Legal and InfoSec teams can evaluate the system in days rather than weeks since there's no image data, no motion signatures, and no biometric information to assess.
- Butlr's sensors are wireless and battery-powered, which means there's no coordination with electricians, no cable runs, and no dependency on existing network infrastructure. A facilities team can mount hundreds of sensors in a single evening and have data flowing within weeks. For organizations managing dozens or hundreds of buildings, that consistency from site to site keeps rollouts on schedule.
- Rather than centralizing data inside a proprietary dashboard, Butlr's API-first model sends occupancy signals outward into your existing platforms. If your facilities team already tracks work orders in an IWMS, your energy team manages HVAC schedules in a BMS, and your leadership reviews metrics in Tableau, the sensor data reaches each of those tools without requiring anyone to log into a new system
Shortcomings
- Butlr doesn't include a built-in analytics dashboard comparable to Density's Atlas. The platform is designed to feed data into external tools, which gives teams flexibility but also means organizations that want a turnkey reporting experience will need to pair Butlr with a BI platform or IWMS to build the visualization layer.
- Thermal sensors can be sensitive to strong ambient heat sources like direct sunlight on the sensor or nearby industrial equipment. This is accounted for during installation through proper sensor placement, but it's worth flagging during site surveys so placement avoids known heat sources from the start.
Density Overview
Density's sensor lineup includes devices designed for large open areas like lobbies and cafeterias, along with doorway sensors that count people entering and exiting specific rooms or zones. Sensors are ceiling-mounted and use on-device processing (where data is analyzed directly on the sensor before being transmitted) to generate detailed spatial data.
All of that data feeds into a proprietary dashboard where customers can view real-time occupancy, historical trends, utilization metrics, threshold alerts, and multi-site portfolio comparisons.
Key Features
- Three Sensor Types: Open-area sensors for large spaces; doorway sensors for entry/exit counting; and a smaller self-installable sensor for meeting rooms, phone booths, and desks
- Analytics Dashboard: A proprietary dashboard that shows real-time occupancy views, historical trend analysis, and space utilization metrics with heat maps, trend charts, and capacity planning tools
- Live Wayfinding: A real-time map that shows employees available workspaces and routes to get there, displayed on touchscreen displays throughout a building
- Adaptive Cleaning: Generates cleaning plans based on actual space usage rather than fixed schedules, with savings visualized on a floor plan
- Threshold Alerts: Teams can set occupancy thresholds and receive alerts when spaces exceed or fall below target levels
- Professional Services and Advisory: Site planning, installation support, ongoing customer success, and workplace advisory services are available
Advantages
- Radar technology captures detailed spatial data, including movement paths and flow patterns across open areas. For teams doing space design research or workplace strategy work, that granularity can directly inform layout decisions.
- Each open-area sensor covers up to approximately 1,000 square feet in ideal conditions. That's a wide footprint per device for large, open environments like lobbies and cafeterias.
- Built-in wayfinding and adaptive cleaning features mean some operational use cases are handled natively within the platform, without requiring third-party integrations.
Shortcomings
- Open-area and doorway sensors are ceiling-mounted and wired, requiring professional installation, power drops, and network infrastructure. For multi-building portfolios, that coordination adds weeks or months to deployment timelines and increases cost at every site.
- The proprietary dashboard is the primary way customers interact with their data. API access exists, but direct integration into external platforms like IWMS, BMS, or BI tools isn't central to the product approach.
- Radar-based sensing faces scrutiny in privacy-sensitive markets. 60GHz radar at this resolution can produce identifiable motion signatures, which means longer review cycles with legal, InfoSec, and works council teams, and potential rejection in healthcare or government settings, particularly in the EU.
A Side-by-Side Comparison of Butlr and Density
Butlr and Density both serve enterprise organizations looking to understand how their spaces are being used. But the two platforms are built on fundamentally different sensing technologies: Density uses 60GHz radar to create detailed spatial maps of movement, while Butlr uses thermal sensing to detect presence and occupancy without capturing any identifiable data.
That technology choice affects far more than sensor specs. It determines how quickly you can deploy across a portfolio and how your legal and privacy teams will evaluate the system. It also affects where you can physically install sensors and whether your occupancy data stays inside a proprietary dashboard or flows into the systems you already use.
Below, we've summarized the key differences at a glance, followed by a detailed breakdown of each category.
Sensor Technology
Butlr reads thermal energy and converts it into occupancy metrics like headcount, dwell time, and directional traffic. Because the sensor physically can't generate images or silhouettes, it works in sensitive spaces like restrooms, patient rooms, and elder care facilities.
Density's radar creates richer spatial maps, including movement paths and flow patterns, but that resolution comes with tradeoffs. The open-area sensors need to be ceiling-mounted, and real-world obstacles like partitions and varied ceiling heights can reduce effective coverage.
Key Takeaway: Density offers more granular movement data. Butlr offers more flexibility in where you can install the sensor.
Connectivity Options
Every Butlr sensor runs on battery power and connects wirelessly. There's one deployment model regardless of whether you're instrumenting a conference room, a cafeteria, or a restroom, and sensors can be relocated if your floor plan changes.
Density uses two different connectivity models. The self-installable sensor plugs into a wall outlet and joins Wi-Fi, which works for enclosed rooms. Open-area and doorway sensors need hardwired PoE and network drops, so a typical portfolio deployment means managing both installation workflows in parallel.
Key Takeaway: Butlr's single, consistent deployment model simplifies planning and reduces surprises at scale. Density's split approach adds coordination overhead.
Butlr's thermal approach means personal data never enters the system. There's nothing to scrub, mask, or govern because the hardware doesn't collect it. That simplifies procurement conversations with legal, InfoSec, and works council stakeholders. It's also why the platform operates in privacy-restricted environments that most sensing technologies can't access.
Density doesn't use cameras, but its radar generates data that's detailed enough to reflect gait and body shape. Whether that crosses a privacy threshold depends on the evaluator. In practice, some EU works councils and healthcare compliance teams require additional review for this type of data, and that review adds time to the buying process.
Key Takeaway: Butlr removes the privacy question entirely at the hardware level. With Density, the answer depends on how your organization classifies spatially resolved radar data.
Installation Timeline
Butlr's wireless sensors can be installed at scale in days. Hundreds of devices can go up overnight, and actionable data is typically available within three weeks. Butlr works with global deployment partners to coordinate multi-site rollouts.
Density's self-installable sensor is similarly fast for individual rooms. The bottleneck is open-area coverage, which still requires ceiling access, cable runs, and IT sign-off. A single building can take several weeks; a multisite rollout multiplies that by every location.
Key Takeaway: For smaller rooms, both platforms can move fast. For full-building and multi-site coverage, Butlr's uniform wireless model avoids the infrastructure sequencing that slows wired deployments down.
Accuracy
Butlr's thermal detection holds at 95% across varying light levels, ceiling configurations, and room types. The consistency is important because enterprise portfolios rarely have uniform conditions from building to building.
Density also targets 95% and hits that mark in standard open-plan environments. Performance becomes less predictable in spaces with low ceilings, radio frequency (RF) interference, dense partitions, or overlapping sensor fields.
Key Takeaway: The accuracy specs are similar on paper. The difference shows up in how much work it takes to maintain that accuracy across a diverse set of real-world spaces.
Integrations
Butlr is designed to integrate with the tools teams already use. Teams can sync occupancy signals with workplace management tools, building automation systems, BI dashboards, and cleaning orchestration software. For teams without engineering resources, a managed integration service handles the connections.
Density centralizes the experience inside its own dashboard, which includes native wayfinding and cleaning optimization tools. An API exists for data export, but the product is designed around the assumption that most users will work within the Density environment.
Key Takeaway: If your organization already has a workplace tech stack and wants occupancy data embedded in it, Butlr's architecture is built for that. If you prefer a single destination for analytics with built-in operational features, Density's model fits better.
Price
Density ranks as one of the most expensive occupancy sensing platforms on the market, driven by high hardware costs and wiring that runs 1-2.5x the device cost. Installation complexity adds additional overhead. Butlr sits at the opposite end of the spectrum, with straightforward installation and no wiring costs to factor in.
That gap comes down to what's required to get sensors operational. Density's radar sensors need professional mounting, cabling, and network infrastructure at every location. Butlr's wireless thermal sensors don't, so there's no installation multiplier on top of the hardware.
Key Takeaway: Density carries the highest total cost among occupancy sensing platforms. Butlr carries the lowest. The difference is driven almost entirely by installation overhead.
Overall Assessment
Density is a strong platform with real strengths. Its proprietary dashboard offers polished, detailed spatial analytics out of the box, while its radar technology captures granular movement data that can be valuable for targeted space design projects. The company has built a recognized brand within the commercial real estate market.
But for organizations that need occupancy intelligence working across a large or complex portfolio, Butlr is purpose-built for that scale. Butlr's hardware-level privacy simplifies compliance approvals, its wireless deployment scales consistently across buildings, and its API-first architecture puts the data inside the systems your teams already use. Combined with lower total cost of ownership, those advantages add up to a platform that gets more efficient as you grow.
The two platforms serve different priorities. If your primary need is detailed movement analytics for a contained set of locations and you want everything inside a single proprietary dashboard, Density deserves a look. But if you need occupancy data flowing across your organization's systems, deployed across a diverse portfolio, with hardware-level privacy and a cost structure that scales, Butlr is the stronger fit.
Choose Butlr if...
- Privacy compliance is nonnegotiable and you need a solution that passes legal, InfoSec, and works council review without extended cycles
- You need to deploy across a large or complex portfolio quickly, without wiring, electricians, or ideal ceiling conditions
- You want occupancy data flowing into the systems you already use (IWMS, BMS, BI tools, cleaning platforms) rather than living inside a proprietary dashboard
- Your portfolio includes sensitive spaces like restrooms, patient rooms, labs, or senior living facilities where camera or radar-based systems face restrictions
- You have a large building portfolio, so total cost of ownership at scale matters
- You need a partner that supports staged, multisite rollouts without significant cost increases per square foot
Choose Density if...
- Granular movement analytics (motion paths, spatial flow mapping) are central to your space design or workplace strategy goals
- You want a vertically integrated analytics platform with built-in heat maps, trend charts, and observation tools and are comfortable working primarily within that environment
- Your deployment is focused on a smaller number of venues with relatively standard office layouts and suitable ceiling heights
- You have a very large budget for workplace analytics
See How Butlr Fits Your Organization
For organizations evaluating occupancy sensing platforms, the best next step is to see how the data works in the context of your specific spaces, portfolio, and existing tech stack. Go here to request a demo of Butlr.


%20(1).png)
.png)
.webp)
