10 Occupancy Sensor Use Cases for Smarter Workplaces
Occupancy sensors get pitched on a handful of familiar benefits, like right-sizing your portfolio, optimizing your meeting rooms, and saving on energy. Those are common use cases, but they account for only a fraction of how enterprise teams are actually putting the technology to work.
The challenge when evaluating sensors is understanding the full range of problems they can solve once installed, and whether that range justifies the investment for your organization. A sensor that starts in a conference room can also end up informing cafeteria food prep, cleaning schedules, lease negotiations, and lab equipment planning.
This article covers 10 use cases for workplace occupancy sensors, including the ones that show up often and the most unique ones we’ve come across with our own customers at Butlr.
1. Space Utilization and Portfolio Right-Sizing
The problem
CRE teams are asked to defend lease renewals and floor consolidation decisions, but the utilization data available to them (badge swipes, headcount estimates, walk-throughs) doesn't tell them which spaces are actually being used, and how consistently.
How sensor data solves it
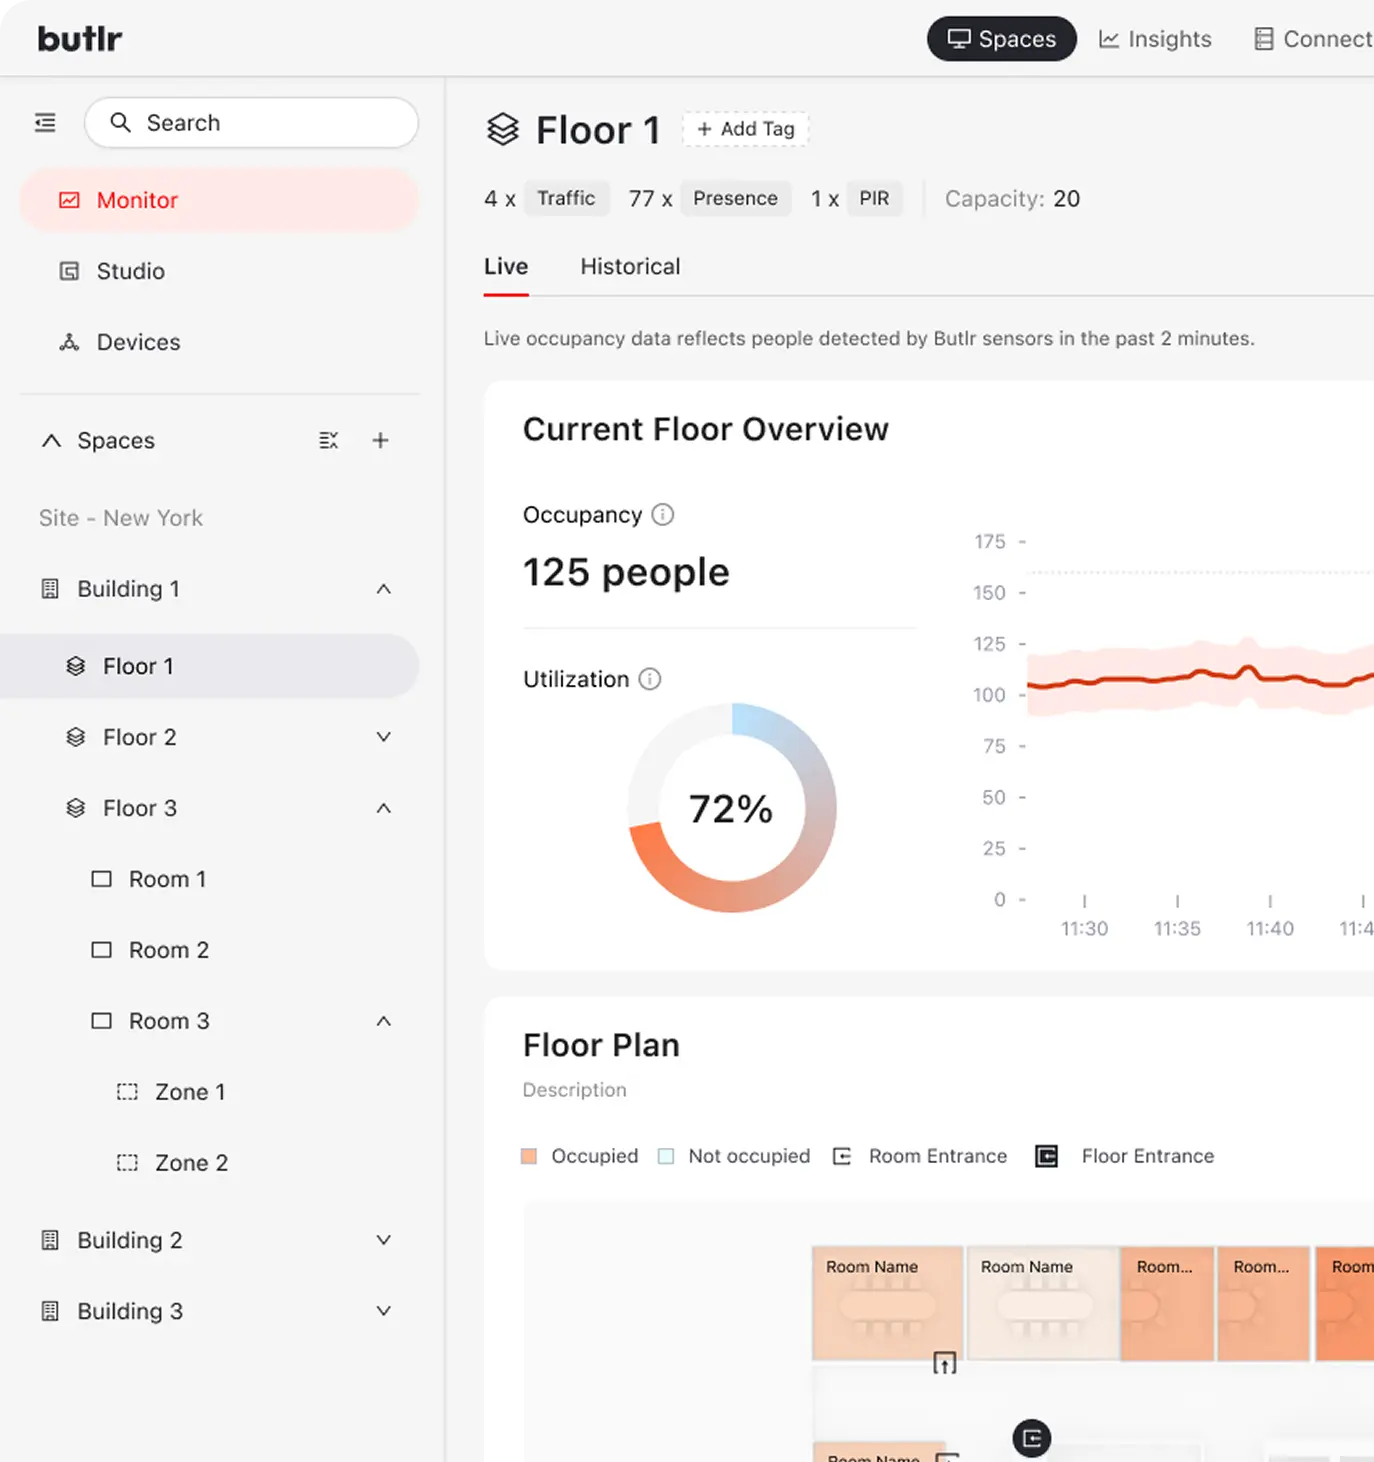
Occupancy sensors installed across floors and zones capture continuous utilization data. They track how many people are present in a given space, what times of day usage peaks and drops, and which neighborhoods or floors are consistently underutilized.
This data builds a time-series picture over weeks and months, replacing snapshot walk-throughs with trend lines that hold up in executive presentations and lease negotiations.
The distinction between "assigned" and "used" is critical here. A floor may have 200 assigned desks, but if sensors show peak daily occupancy of 80, that's a right-sizing opportunity.
The result
Sensor-informed portfolio decisions have helped enterprise organizations cut lease costs and reduce consolidation expenses. Imagine a company leases five floors and sensors show one of them consistently sits below 15% occupancy.
That trend data, built over weeks or months, lets them walk into a lease renewal with a data-backed case to consolidate rather than relying on walk-through impressions or headcount guesses. The data also gives CRE teams defensible evidence when leadership questions why a floor is being given up or a lease isn't being renewed.
Sensor-informed portfolio decisions have saved enterprise organizations significant amounts in avoided lease costs and consolidation savings. The data also gives CRE teams defensible evidence when leadership questions why a floor is being given up or a lease isn't being renewed.
2. Meeting Room Optimization
The problem
Employees report that no meeting rooms are available, yet walk the halls and find rooms sitting empty with active calendar reservations. The disconnect between booked and occupied is one of the most common complaints in hybrid offices.
How sensor data solves it
Presence sensors in meeting rooms detect whether anyone is physically in the room, regardless of what the calendar says. When no presence is detected within a set window (typically 10 to 15 minutes), the booking is auto-released and the room becomes available again.
Beyond auto-release, sensor data uncovers deeper patterns. It shows which room sizes are overbooked versus underused, how many people actually attend meetings booked in large rooms, and which time slots experience the most contention. A 12-person room regularly used by two people is a seat-ratio problem, not a supply problem.
The result
Workplace analytics data from firms like Worklytics shows that nearly 30% of booked meeting rooms go unused in hybrid offices, with no-show rates reaching as high as 40% in some organizations. Recovering even a portion of that capacity can eliminate the need to build additional rooms, each of which can cost tens of thousands of dollars in construction, AV, and furniture. It also reduces daily friction for employees trying to find a space to meet.
3. Cafeteria and Food Service Planning
The problem
Corporate food service teams need accurate headcounts to plan meal prep, staffing, and purchasing. Without reliable data, cafeterias either overproduce (wasting food and budget) or underproduce (frustrating employees and creating long lines during peak hours).
The traditional workaround is surprisingly manual. Some teams count used utensils or trays after service to estimate how many people ate.
How sensor data solves it
Traffic-mode sensors installed above cafeteria entrances count the number of people entering and exiting during service windows. That data feeds into dashboards accessible to both the facilities team and the food vendor, replacing manual estimates with a continuous, accurate count.
Here's an example from a Butlr customer. A fast-growing global AI company with six offices across the US and Europe had been relying on manual utensil counts to estimate cafeteria demand. After deploying Butlr's thermal sensors in dining areas, the sensor-based count became the official source of truth for diner estimates.
Butlr's sensors use thermal detection only, capturing anonymous occupancy data with no cameras, no images, and no personally identifiable information. The food vendor now uses this data directly, and the internal team is questioning whether manual counting needs to continue at all.
In a separate deployment, a leading international IT services company used Butlr's sensors to gain real-time visibility into cafeteria occupancy, using the data to reduce food waste and improve the dining experience during peak hours.
The result
More accurate food prep means less waste and better service. For large campuses serving hundreds or thousands of meals daily, even small improvements in forecasting accuracy translate to meaningful cost savings and a better employee experience.
If you're evaluating occupancy sensors, it's worth asking vendors how flexible the hardware and data are across different applications. See how Butlr's platform adapts to use cases beyond the standard playbook, all without any privacy concerns.
4. Demand-Based Smart Cleaning
The problem
Cleaning crews typically follow fixed schedules and routes, servicing every floor and every restroom on the same rotation regardless of whether anyone used them. This wastes labor on empty spaces and can leave high-traffic areas underserviced.
Restrooms are a particularly tricky case. They're high-priority for occupant satisfaction, but cameras obviously can't go there, so facilities teams have no way to know which ones need attention and which ones have barely been used.
How sensor data solves it
Sensors track which rooms, floors, and restrooms were actually used throughout the day. That usage data triggers work orders or cleaning dispatches only for spaces that saw traffic, and can prioritize high-usage areas for more frequent service.
This approach replaces the fixed schedule with a usage-driven model. If the third floor had 15 people on it and the fifth floor had 120, cleaning resources are allocated proportionally.
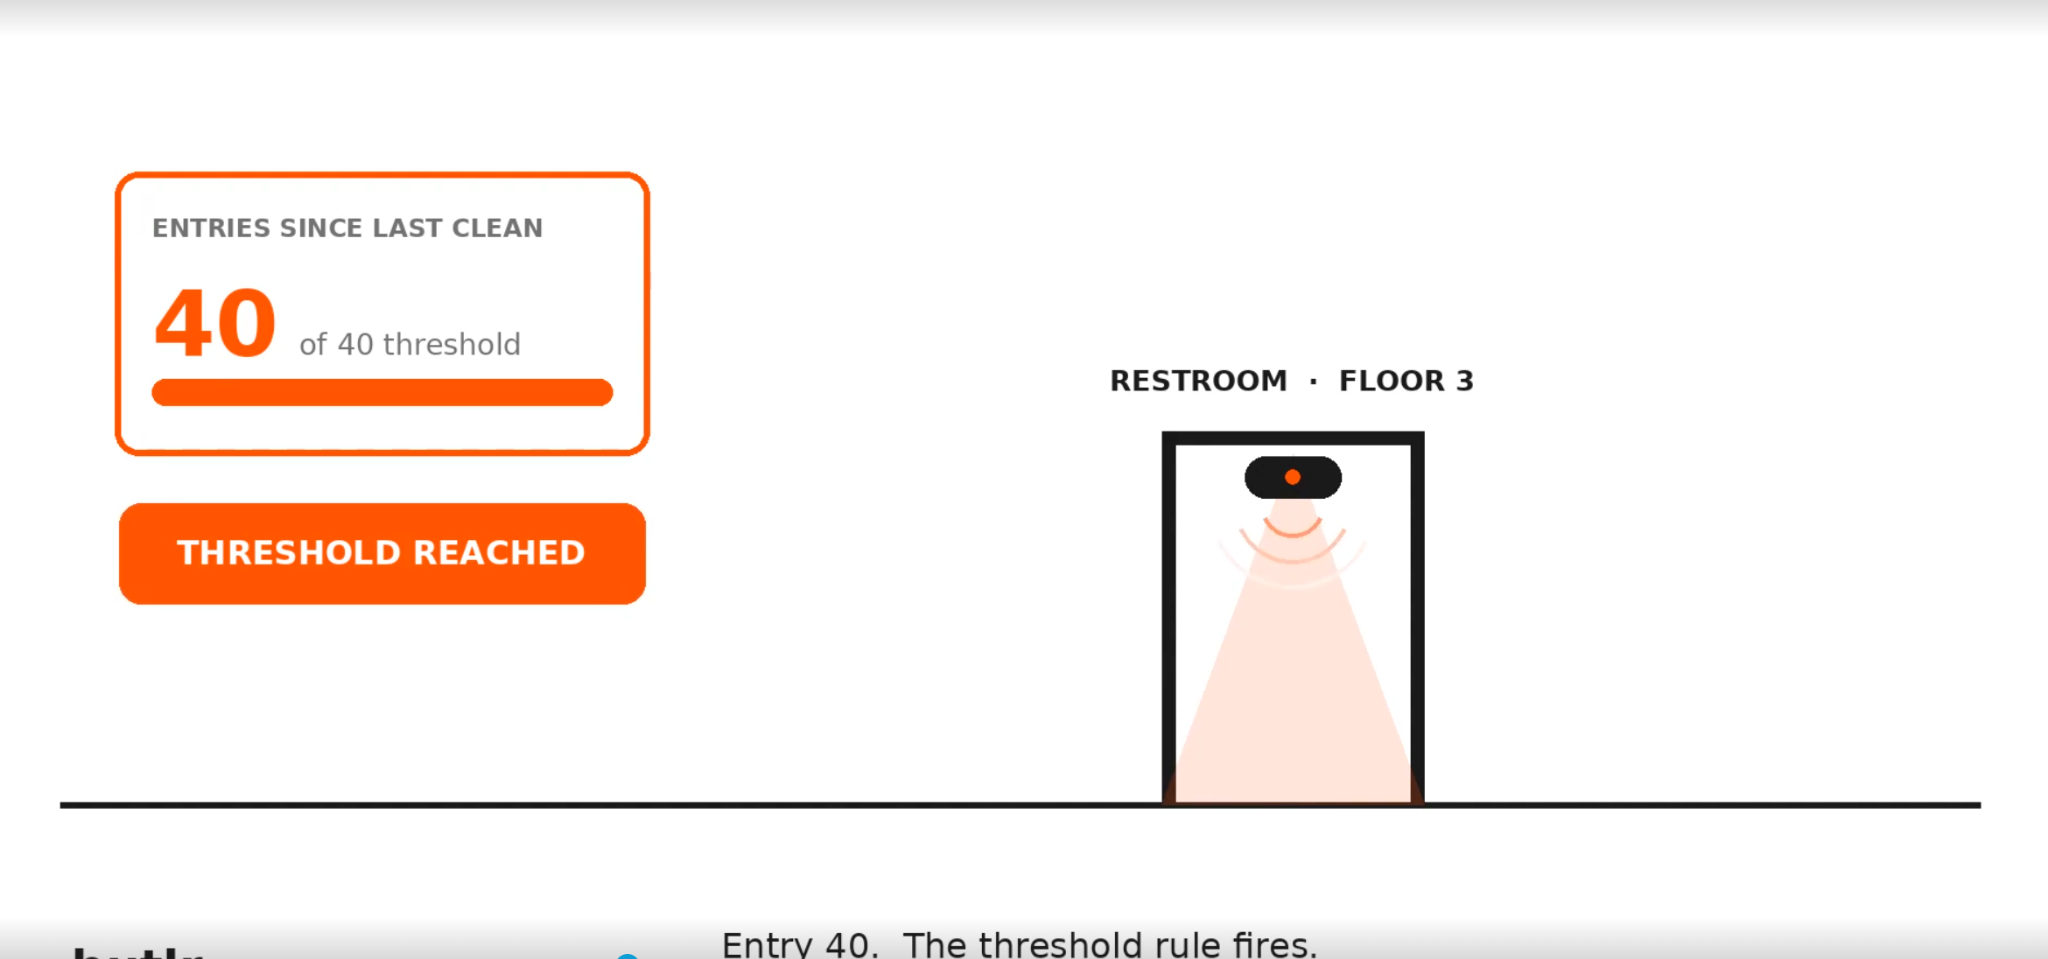
Butlr's Smart Cleaning module uses thermal sensor data to send threshold alerts when restrooms and other high-traffic spaces hit usage thresholds, and generates automated work orders that feed directly into a facility's CMMS. Day-of-week heatmaps show when spaces actually get used, so teams can staff for the days that need it.
The result
Shifting from fixed schedules to usage-driven cleaning can meaningfully reduce janitorial labor costs for large portfolios, while actually improving service levels in the spaces that need it. Butlr customers report average savings of around $1,400 per restroom per year. The approach also documents cleaning frequency for compliance, tenant reporting, and vendor accountability.
5. Gym and Amenity Planning
The problem
Corporate amenities like gyms, wellness rooms, and lounge areas are planned based on building headcount or employee surveys, not on actual usage data. This leads to either overcrowded amenities (especially at peak times) or underused investments that are difficult to justify at renewal.
How sensor data solves it
Traffic sensors at amenity entrances capture daily and hourly usage volumes, showing which times of day are busiest, which days of the week see the most demand, and how usage trends shift over time.
The same global AI company that deployed sensors in its cafeteria also placed Butlr sensors in gym facilities across its headquarters campus. With more than 100 new hires per week at peak growth, amenity planning couldn't keep up with headcount. Sensor data provided an ongoing read on actual gym usage, replacing assumptions based on employee surveys or building capacity.
The result
Amenity decisions backed by usage data are easier to defend internally. The data backs decisions to expand gym hours, add equipment, or convert an underused wellness room into a collaboration area.
6. HVAC and Energy Optimization
The problem
HVAC systems in large office buildings typically run on fixed schedules or whole-building setpoints. On days when only two of five floors are occupied, the building still heats, cools, and ventilates all five. This is one of the largest controllable operating expenses in commercial real estate.
How sensor data solves it
Presence sensors at the zone or floor level feed occupancy data to the building management system (BMS) in real time. The BMS then adjusts HVAC setpoints based on which zones are actually occupied, scaling conditioning up or down accordingly.
This can also apply at the room level. If a conference room is booked but sensors show no one has arrived, the system doesn't ramp up cooling for that space.
The result
Occupancy-driven HVAC control has been shown to produce meaningful energy savings. A 2025 Schneider Electric study found that occupancy-based controls reduced operational energy use and carbon emissions in meeting rooms by 22%, and academic research has documented savings in the 17 to 24% range.
Given that HVAC accounts for roughly 40% of energy use in commercial buildings, according to U.S. Department of Energy data, even the low end of that range translates to a large reduction in both operating cost and carbon output.
7. Lab Utilization and Equipment Reservation
The problem
Labs that house sensitive R&D and specialized equipment have unique monitoring constraints. Cameras are often a non-starter due to proprietary research and privacy policies.
But the need for utilization data is just as pressing. Lab strategy teams need to know which labs are being used, how heavily, and whether expensive equipment is sitting idle or oversubscribed.
How sensor data solves it
Traffic-mode sensors above lab doorways count entries and exits, providing a baseline for how each lab is used across a portfolio. Presence-mode sensors can also be placed around individual pieces of equipment (safety cabinets, benches, specialized instruments) to give zone-level visibility into whether specific assets are actively in use.
A global medical device company deployed Butlr's thermal sensors across six sites in North America and Europe. The sensors were installed above doorways in traffic mode, counting entries and exits. Because the sensors detect only body heat (no cameras, no PII), lab owners and technicians accepted them in environments where visual monitoring would never be approved.
The workplace strategy team uses this data as the baseline for measuring whether changes to lab operations are working. They pull 30-, 60-, and 90-day trends through Butlr's API into Tableau dashboards, calculating occupancy during business hours, the specific metric their leadership cares about.
As a next step, the company is using presence-mode sensors to create zones around individual equipment, feeding live availability into its desk-booking platform. A single sensor can cover four or more pieces of equipment.
The result
Continuous sensor data replaces periodic walk-throughs as the basis for lab strategy decisions. The equipment reservation layer also reduces scheduling conflicts and surfaces underutilized assets that could be shared or consolidated.
8. Lease Dispute Evidence
The problem
When lease negotiations turn contentious, a landlord disputes a tenant's claim that a space is underused, or a tenant needs evidence to justify early termination or renegotiation, the data available is usually limited to badge swipes or anecdotal accounts. Neither holds up well under scrutiny.
How sensor data solves it
Traffic sensors provide timestamped, continuous records of how many people entered and exited a space. That objective usage history supports lease discussions with hard evidence.
When the global medical device company mentioned above needed usage data at one site to inform a lease dispute, Butlr shipped and installed cellular-connected sensors within a week. The cellular connection bypassed the typical IT approval process entirely, which had been a bottleneck with previous solutions.
As the company's Workplace Strategy Lead put it: "I love that we have the data so quickly, something we were never able to do before. We're using cellular data instead of depending on IT, which gives us so much more flexibility than other solutions."
The result
Objective, sensor-generated usage records that can be presented in lease negotiations. The speed of deployment (days rather than months) matters here because lease disputes often operate on tight timelines.
9. Hybrid Work Planning and RTO Measurement
The problem
Organizations rolling out hybrid work policies or return-to-office mandates need to know whether those policies are actually reflected in attendance. Badge data shows building entry but doesn't capture how people move through the space once inside, or whether specific floors, neighborhoods, or collaboration zones are seeing the expected traffic.
How sensor data solves it
Sensors across floors and zones track daily attendance at a granular level, showing which days see the most traffic, which departments are coming in, and how attendance patterns shift over time. This data validates (or contradicts) assumptions baked into hybrid policies.
It also supports seat-ratio planning. If policy says employees should come in three days a week but sensors show average daily occupancy is 40% of capacity, you're likely holding more desks than you need.
That data gives the CRE team grounds to move from a 1:1 desk-to-employee ratio to something closer to 1:2, freeing up square footage for collaboration areas or pulling it out of the lease altogether.
The result
Policy decisions are grounded in actual attendance data. Survey responses and badge counts can't provide the same granularity. Leadership gets evidence that a hybrid policy is working, and CRE can resize the portfolio in response to attendance patterns that don't match original projections.
10. Centralized Occupancy Data Lake
The problem
Large enterprises often deploy sensors for a specific project (a floor renovation, a pilot study, a single building), and the data lives in a silo. When leadership wants a portfolio-wide view of space utilization across multiple offices, cities, or countries, there's no unified dataset to pull from. Each site may use different tools, formats, or reporting cadences.
How sensor data solves it
Sensors across an entire portfolio feed data into a centralized data lake via API. The resulting unified dataset can be queried for any use case, from food services, space planning, energy optimization, cleaning, and amenity management. At this stage, sensors function as shared enterprise infrastructure.
The global AI company that started with a single Butlr deployment at its headquarters has expanded to six offices across the US and Europe. The workplace intelligence team (a lead, a data analyst, and a dedicated program manager) now pulls all Butlr sensor data into a centralized data lake tied to a master "source of truth" table. That table is the foundation for decisions about facilities, food services, and space planning at every office.
What started as one project has become so expansive that the internal team has to ask "which Butlr project are we talking about?" when coordinating across concurrent deployments.
The team is also building a technology health command center. It’s a scalable way to confirm every global sensor is running and streaming clean data without manual oversight.
The result
One dataset powering multiple operational and strategic decisions across a global portfolio. Consolidating occupancy data into a single, accessible layer means every team from facilities to real estate to food services can draw from the same numbers.
If you’re curious to see how other organizations cut real estate costs and improve the employee experience, read our case studies here.