


.svg)


10 Top-Rated Office Space Utilization Software Options
Workplace teams routinely make six- and seven-figure decisions about leases, floor plans, and building operations without a reliable read on how their space is being used. Getting that insight requires consistent occupancy data, but most buildings don't produce it on their own.
Space utilization software automates that measurement. These tools track how office space is used so workplace teams can make confident decisions about layouts, lease renewals, and day-to-day operations like cleaning and HVAC.
The category covers a wide range of approaches, though, from physical sensors to booking platforms to portfolio analytics tools. They don't all answer the same questions.
This guide compares 10 platforms by how they collect utilization data, what they measure, and which scenarios each one fits best.
10 Space Utilization Tools at a Glance
The table below compares the 10 tools, including how each one gathers utilization data and who it serves best.
Butlr
Butlr is a privacy-first occupancy sensing platform that measures how people use space without cameras, biometric data, or identity tracking. Its wireless sensors read low-resolution heat signals, and its AI turns those into real-time occupancy and movement data. Because the sensors detect body heat rather than images or devices, they never collect personally identifiable information (PII).
The platform covers more than 30,000 sensors across over 100 million square feet in 22+ countries. In addition to corporate workplaces, Butlr supports higher education campuses, laboratories, smart cleaning programs, and senior living environments.
How Butlr Measures and Improves Space Utilization
Butlr's sensors count occupants anonymously by detecting heat, so utilization data reflects who's physically present rather than who booked a room or connected a device. Each sensor runs in one of two modes. Presence Mode measures desk, room, and zone-level occupancy, while Traffic Mode counts entries and exits at the floor or building level.
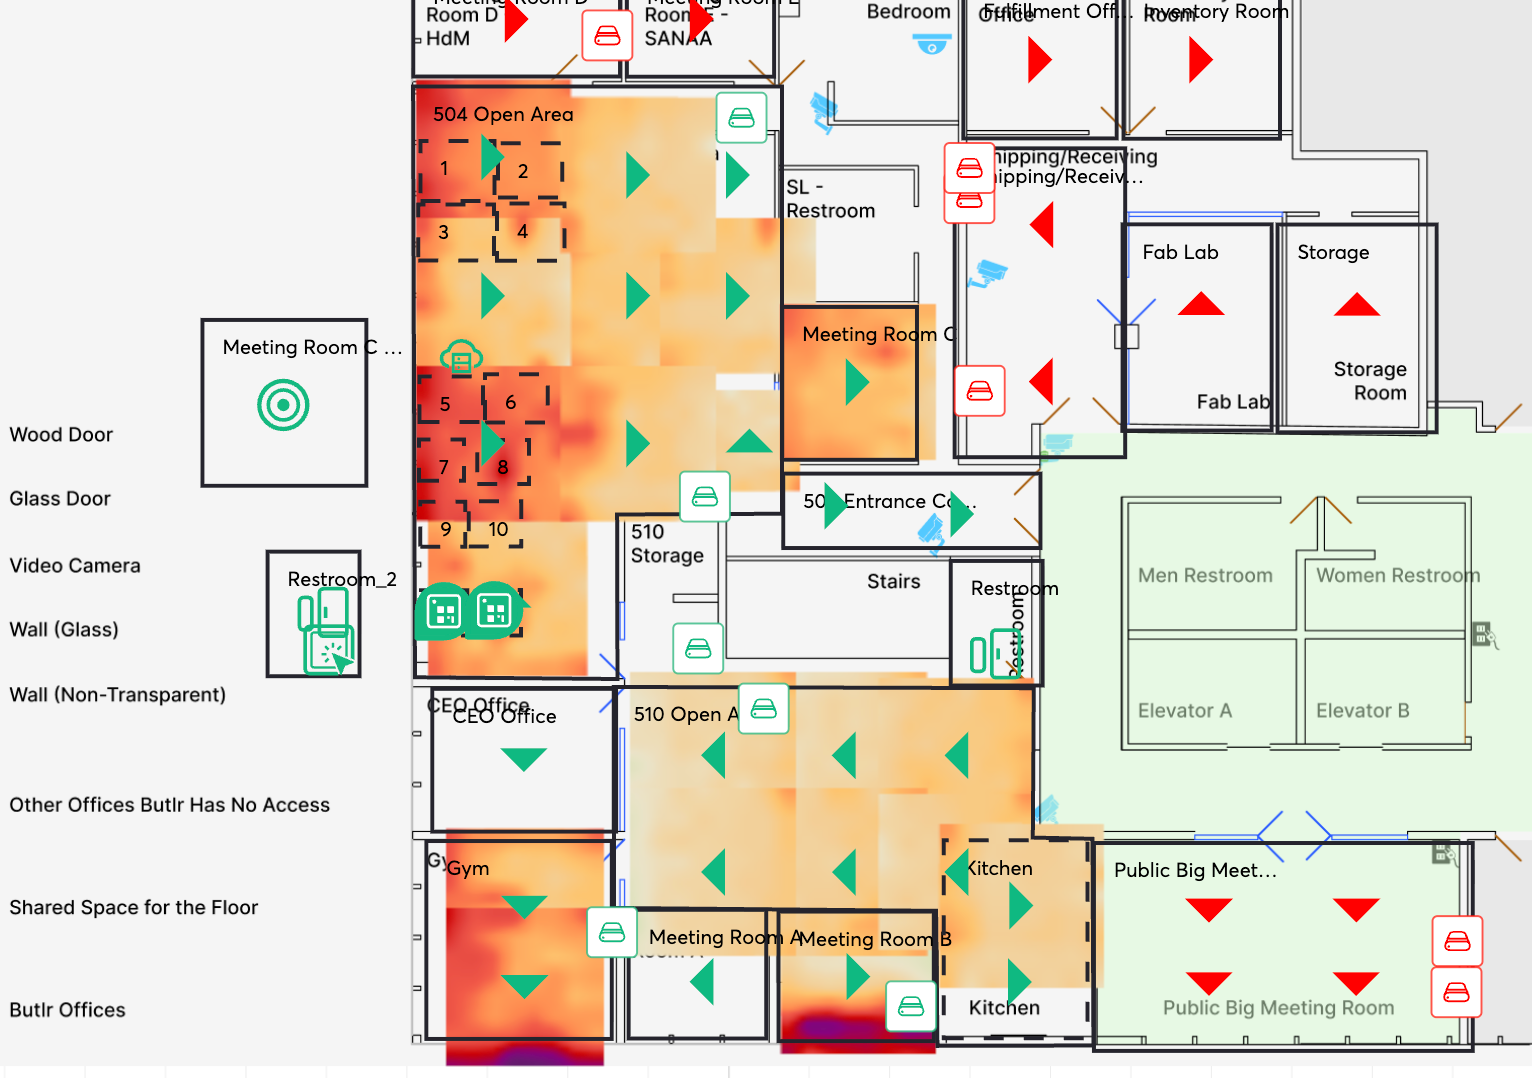
A live dashboard shows real-time occupancy and highlights high-traffic areas. A historical dashboard tracks utilization trends across floors, buildings, and portfolios, giving teams the starting point for a utilization analysis of which spaces to keep, repurpose, or retire.
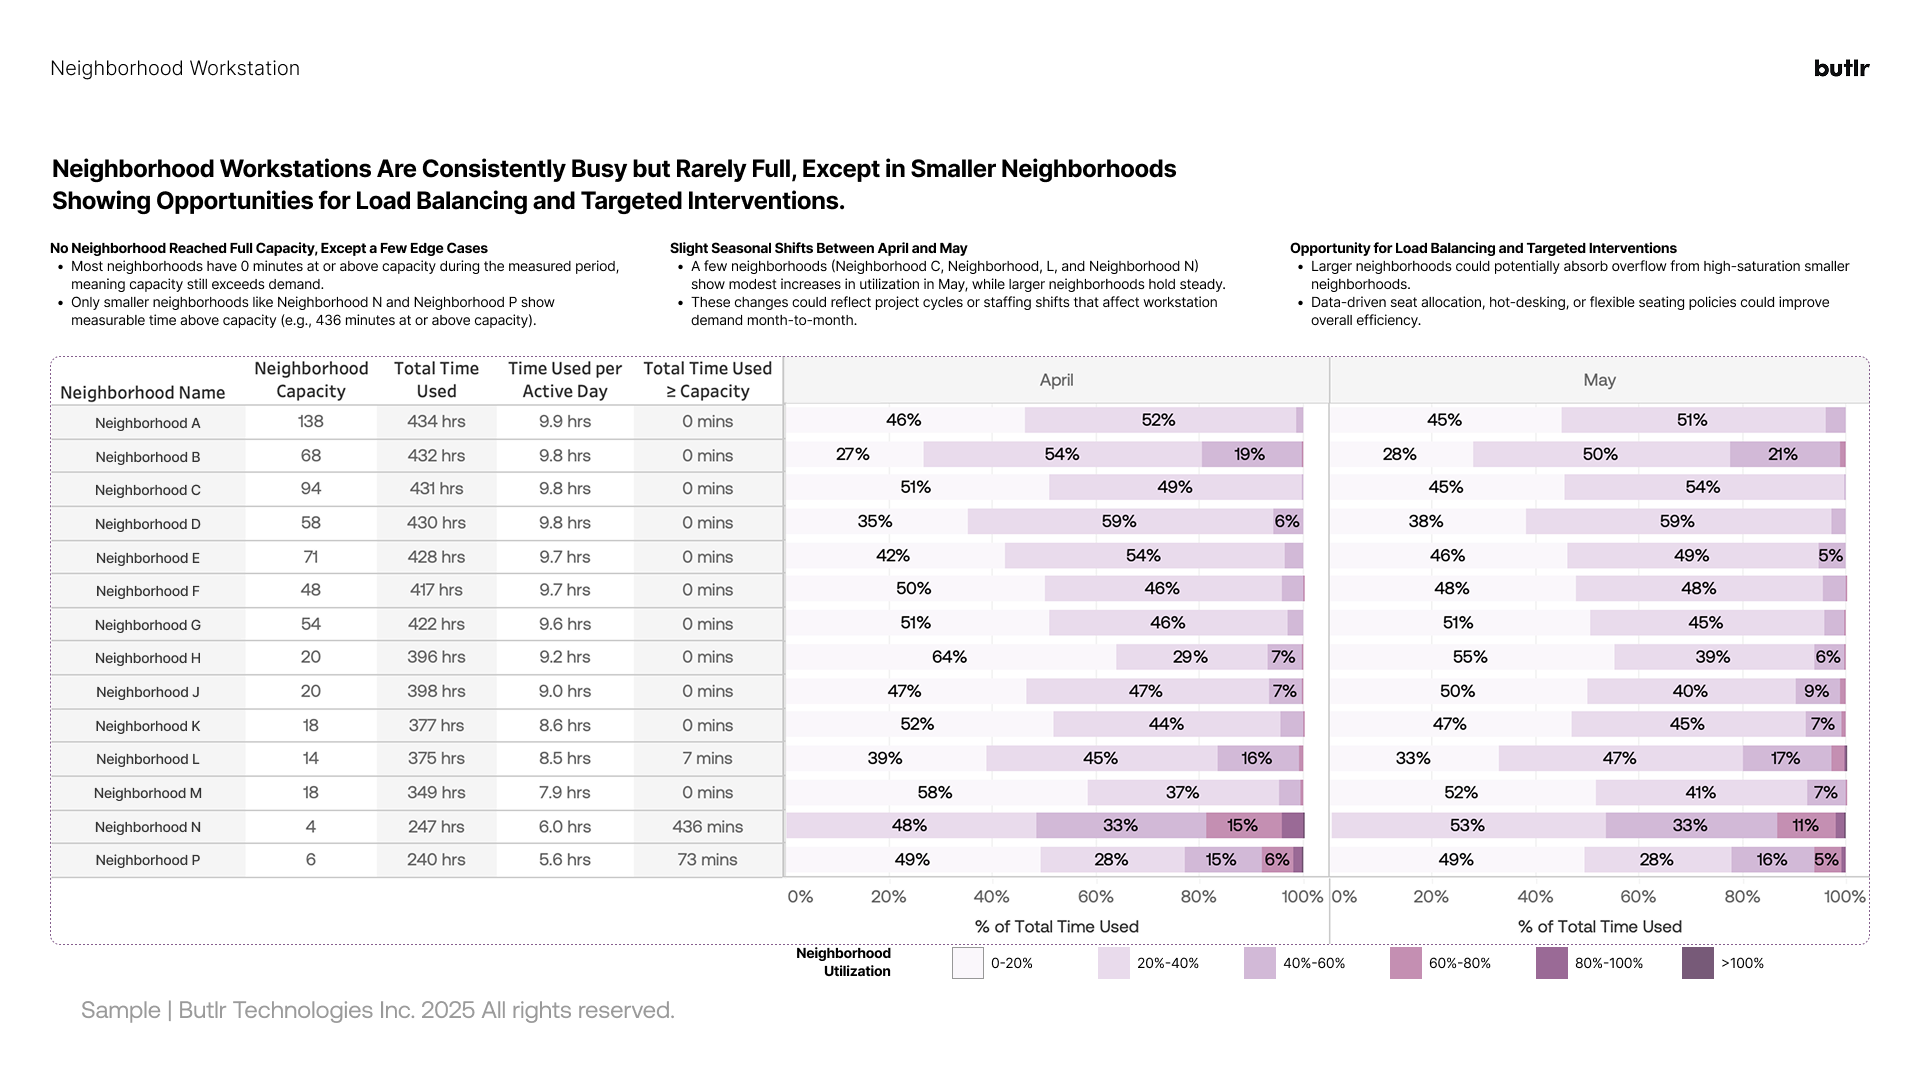
Butlr takes an API-first approach instead of trying to replace the tools teams already use. Its REST API and webhooks feed occupancy data into integrated workplace management system (IWMS) platforms, building management systems (BMS), business intelligence (BI) software, and smart cleaning tools. Real-time data can then trigger automations like demand-based cleaning or HVAC adjustments.
Deployment is fast because the sensors are battery-powered and wireless, with no electrician required. Customers typically have usable data within weeks of installation rather than months. Since the sensors capture no images, they also work in privacy-sensitive spaces like restrooms and healthcare environments where cameras can't go.
Key Features
- Anonymous Thermal Sensing: Low-resolution heat detection counts people with 95% accuracy and never captures images, identities, or PII.
- Two Sensor Modes: Presence Mode measures desk, room, and zone occupancy, while Traffic Mode counts entries and exits for floor or building-level data.
- Live and Historical Dashboards: Real-time views support daily operations, and historical trends inform planning, reporting, and portfolio comparisons.
- REST API and Webhooks: Occupancy data flows into IWMS, BMS, BI, and smart cleaning platforms, with plug-and-play integrations across 30+ software partners.
- Fast, Wireless Deployment: Battery-powered sensors install without rewiring, and portfolios go from order to actionable data in about three to five weeks.
- Enterprise-Ready Compliance: SOC 2 Type II certification and a no-PII architecture simplify legal, IT, and works council review.
Best for: Enterprise and mid-market teams that need accurate, anonymous occupancy data across large or multi-building portfolios, especially where privacy requirements rule out camera-based options.
Request a demo to see how Butlr captures utilization data across your portfolio.
Robin
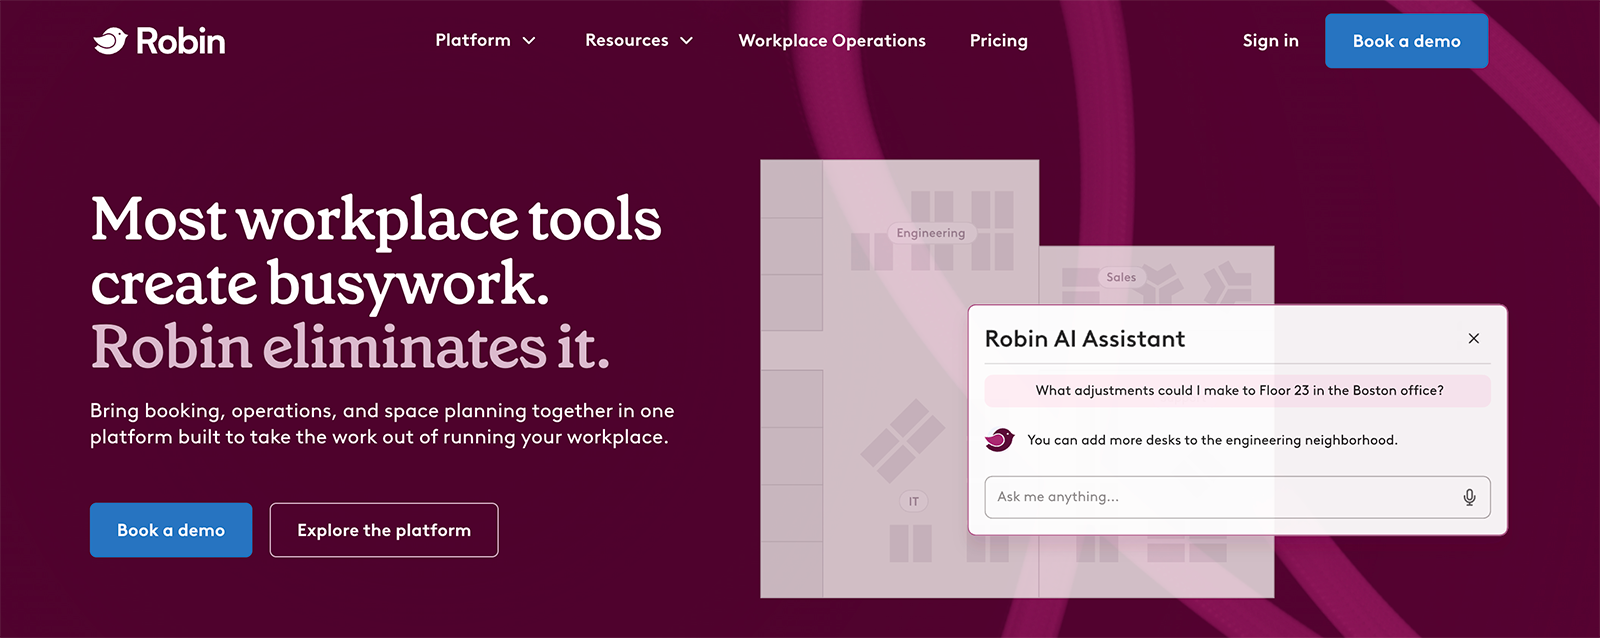
Robin is a workplace management platform that brings booking, operations, and space planning together in one place. Employees use it to reserve desks, rooms, lockers, and parking, while IT, facilities, and workplace teams use it to plan layouts, manage meetings and visitors, and track how the office is used. AI features help with booking, space recommendations, and analytics.
How Robin Measures and Improves Space Utilization
Robin's workplace utilization data comes from booking behavior. The platform tracks reservations and check-ins across desks, rooms, and other resources. It then reports how often each building, floor, and space gets used, along with peak times and who's using them.
Workplace teams can compare planned bookings against check-ins to see where reserved space goes unused. An AI assistant answers quick questions like how much space future demand will require or which rooms rarely earn their footprint.
Booking data captures how people use the reservation system rather than everyone in the building. Robin's analytics can also pull in calendars, access control systems, occupancy sensors, and HR systems to round out the picture.
Teams can use custom reports and historical trends to justify layout changes, desk assignments, and real estate decisions. Hybrid scheduling, office maps, and wayfinding support the day-to-day employee experience.
Key Features
- Resource Booking: Employees reserve desks, rooms, lockers, and parking with AI assistance, from mobile or the apps they already use.
- Workplace Analytics: Utilization and presence reporting shows which resources are used most, with custom reports and scheduled exports.
- Space Management: Teams adjust floor layouts and test changes, with AI recommendations for getting more from each square foot.
- Meeting and Visitor Management: Robin cuts down on double-bookings, matches meetings to appropriately sized rooms, and checks in guests alongside space data.
- Calendar Integrations: Real-time Microsoft 365 and Google Calendar syncing keeps bookings and schedules accurate.
- Wayfinding and Office Maps: Interactive maps help employees find available desks, rooms, and coworkers.
Best for: Mid-market companies with hybrid schedules that need a booking-first platform with built-in utilization reporting.
HubStar
HubStar is a workplace management software platform focused on hybrid occupancy. It covers scheduling and attendance, utilization analytics, and floor plan management. Admins can also use it to organize desk sharing, such as setting seating ratios and grouping desks into team neighborhoods.
How HubStar Measures and Improves Space Utilization
HubStar combines badge, Wi-Fi, sensor, and scheduling data into one view, which lets organizations start with infrastructure they already have. It reads data from several third-party sensor providers, including Butlr, and HubStar also sells its own presence sensors for teams that want more granular counts.
From that combined data, the platform reports historical utilization down to the neighborhood and space type. It predicts future demand from past patterns and suggests where a portfolio could shrink or shift. Teams can set occupancy thresholds and get alerts when spaces cross them.
Workplace and corporate real estate (CRE) teams can compare hybrid policies against attendance, adjust floor layouts based on usage, and share utilization data with business units when discussing space needs. Universities apply the same analytics to campus and classroom utilization.
Key Features
- Multi-Source Data Aggregation: PresenceIQ combines badge, Wi-Fi, sensor, and scheduling data into a single utilization view.
- Three Types of Analytics: Descriptive reporting covers past usage, predictive models estimate demand, and prescriptive suggestions inform right-sizing.
- Occupancy Alerts: Teams set thresholds and receive notifications when spaces run over or under them.
- Dynamic Occupancy Management: Attendance, neighborhoods, and seating ratios can be adjusted as hybrid patterns change.
- Floor Plan Tools: Machine learning assists with floor plan editing, importing, and publishing, and utilization data can be displayed on the plans.
- Sensor and Software Integrations: The platform connects to Wi-Fi infrastructure, third-party occupancy sensors, and tools like Outlook, Teams, and Power BI.
Best for: CRE and workplace strategy teams managing multi-building portfolios that already have data sources in place and need analytics to make sense of them.
Envoy
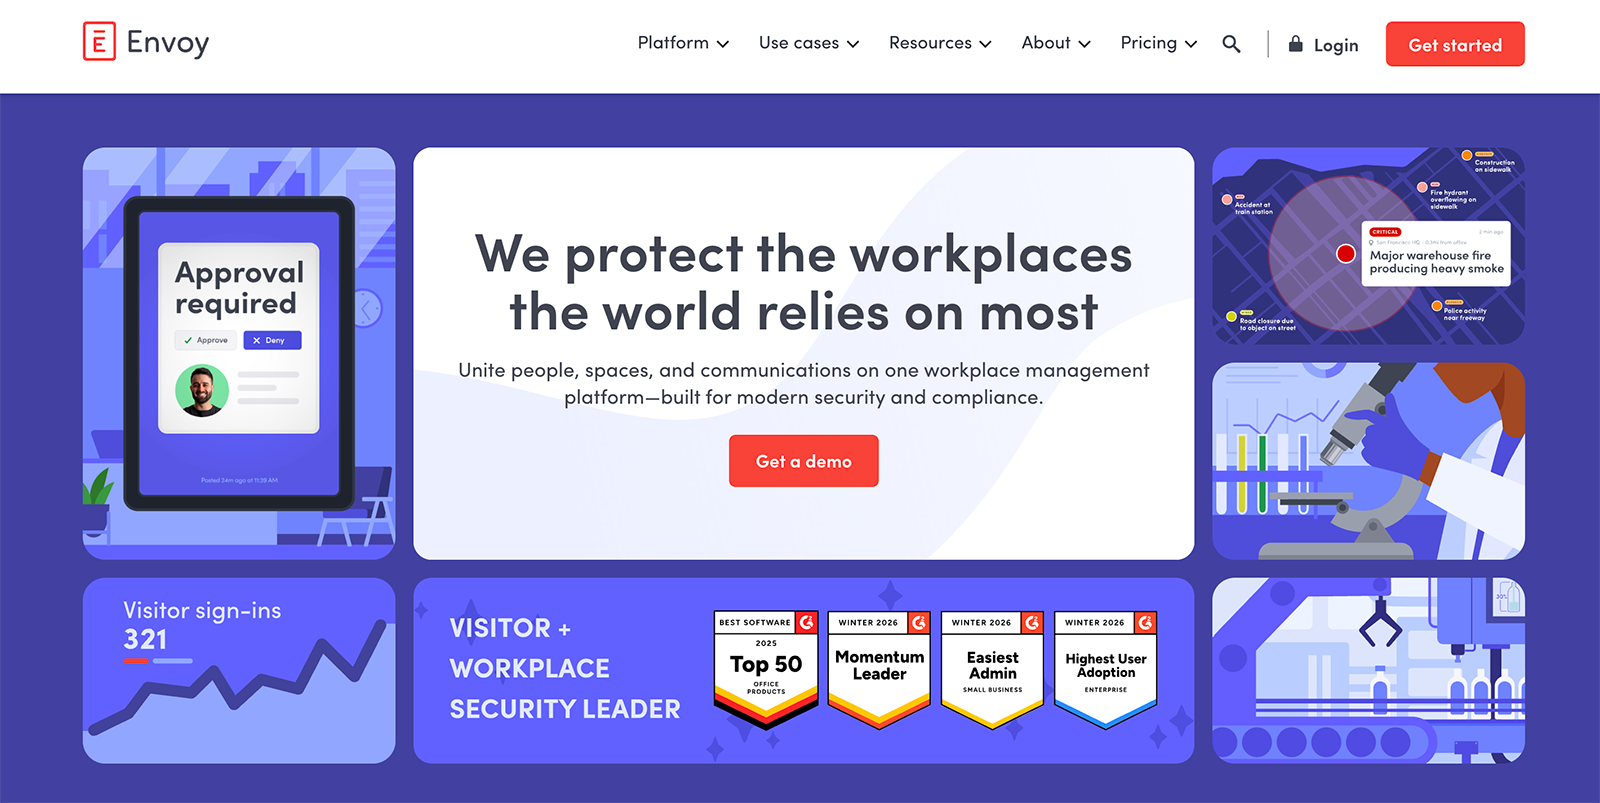
Envoy is a workplace management platform that covers visitor check-in, desk and room booking, parking, deliveries, digital signage, and emergency response. Utilization analytics is one part of that larger suite. The platform leans toward security and compliance-heavy workplaces, such as manufacturing, pharma, and data centers.
How Envoy Measures and Improves Space Utilization
Envoy's utilization data starts with activity already flowing through the platform. Desk and room reservations, employee check-ins, and visitor sign-ins all feed occupancy dashboards. Teams can also connect badge systems, Wi-Fi data, and sensors through Envoy's integrations for a more complete count of who's onsite.
Dashboards show attendance trends, resource usage, and which spaces sit empty most often. Workplace teams can compare occupancy against capacity to decide whether to downsize, sublease, or expand. The same data helps with day-to-day operations like planning catering, facilities staffing, and parking around expected headcount.
Envoy also acts on utilization data automatically. When someone skips a room check-in, the platform can release the booking or nudge them toward a smaller space, which keeps rooms available for people who need them.
Key Features
- Resource Booking: Employees reserve desks, rooms, and parking with live availability, and usage feeds utilization reporting.
- Occupancy Dashboards: Attendance, sign-in, and space usage trends appear in one view, at global or per-location level.
- Data Source Integrations: Badge, Wi-Fi, and sensor data connect through integrations and an open API.
- Room Release Automation: Check-in alerts and nudges free up rooms that were booked but never used.
- Visitor Management: Guest screening and check-in data add to the overall picture of building activity.
- Space Forecasting: Occupancy-versus-capacity comparisons inform lease, downsizing, and reconfiguration decisions.
Best for: Companies that need an all-in-one workplace experience platform with utilization analytics alongside visitor management and hybrid scheduling.
Smarten Spaces
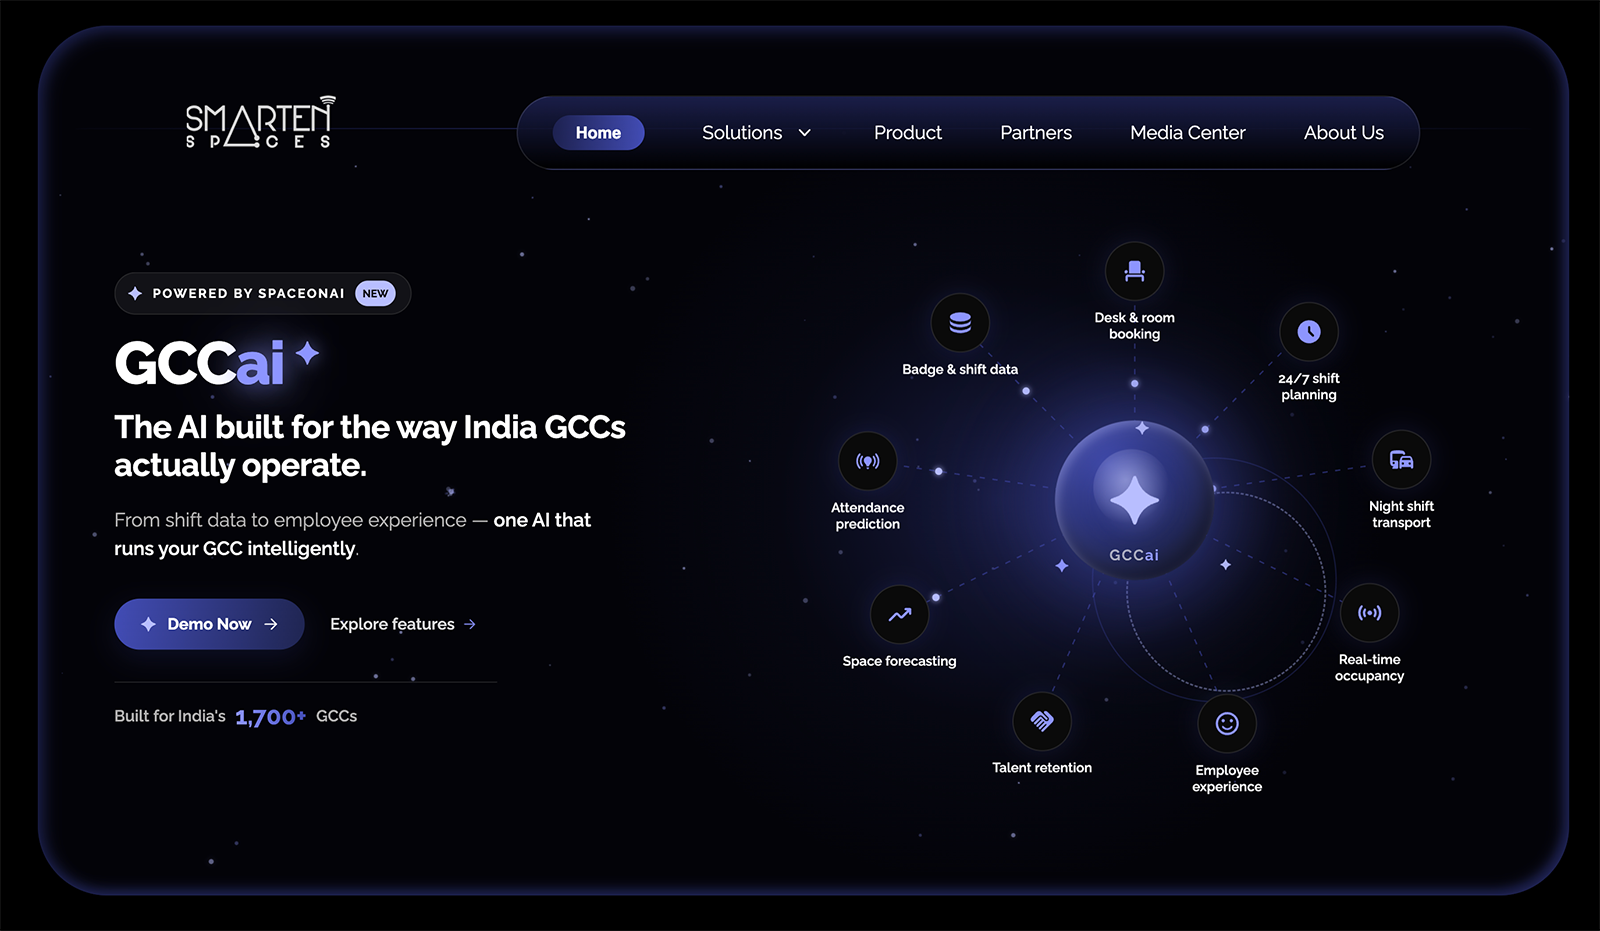
Smarten Spaces makes SpaceOnAi, a workplace platform that uses AI to plan and manage office space. It covers space planning, desk and room booking, and employee experience tools like visitor check-in, service requests, and event listings. The company serves corporate offices along with commercial real estate, global capability centers, and universities.
How Smarten Spaces Measures and Improves Space Utilization
Smarten Spaces builds its utilization picture from booking activity, badge and shift data, and occupancy signals pulled in through integrations. The platform connects to IWMS, CAFM (computer-aided facility management), HR, and booking systems, along with Internet of Things (IoT) sensors, instead of selling its own sensing hardware. It compares space demand against supply across a portfolio to flag overcrowding and underused areas.
AI generates stacking plans that place teams on floors, assigns desks and zones based on usage patterns, and plans department moves. A generative AI assistant answers questions in plain language, like finding desks for a group of new hires or estimating how much space a growing team will need.
Teams can also model scenarios before committing to them, like floor reductions, relocations, or headcount changes. Automated alerts flag underused areas and overcrowding risks as patterns shift.
Key Features
- AI Stacking and Allocation: The platform generates floor plans and desk assignments based on team needs and usage patterns.
- Scenario Modeling: Teams compare options like floor reductions or relocations before making physical changes.
- Demand and Supply Analysis: Real-time comparison of space demand against availability flags gaps across a portfolio.
- Generative AI Assistant: A conversational assistant answers space questions and produces on-demand reports on occupancy and cost per desk.
- Space and Resource Booking: Employees reserve desks, rooms, parking, and lockers with real-time availability.
- Broad Integrations: The platform connects with IWMS, CAFM, HR, and booking systems, plus tools like Microsoft Teams and third-party sensors.
Best for: Enterprises and global capability centers that want AI to recommend and automate space decisions beyond basic utilization reporting.
Basking
Basking is an occupancy analytics and lease management platform for CRE teams. It treats a building's existing network as a sensor, so organizations can measure utilization without installing new hardware. The platform also handles lease administration, including AI-driven abstraction of lease documents, and connects lease costs to how space gets used.
How Basking Measures and Improves Space Utilization
Basking's starting point is the corporate Wi-Fi network. Devices connecting to access points serve as an occupancy signal, which means a portfolio can begin producing utilization data with no new installations. Users can add wired network connections, badge systems, booking apps, and several sensor types via integrations for a fuller or more granular count.
One trade-off to weigh is that network-based measurement counts device presence rather than people directly. Accuracy differs from dedicated sensing hardware, though Basking supports adding sensors where more precision matters.
Dashboards report occupancy by floor, building, and portfolio, with built-in benchmarks for comparing locations. When a site runs under capacity, the platform suggests either raising headcount or cutting workstations, with the projected occupancy and financial effect of each. Because lease records live in the same platform, teams can weigh rent obligations against real usage ahead of renewal decisions.
Key Features
- Network-Based Occupancy Sensing: Existing Wi-Fi and wired network infrastructure doubles as an occupancy data source, with no hardware installation required.
- Multi-Source Integrations: Badge systems, passive infrared (PIR) and thermal sensors, booking apps, and IWMS platforms can feed the same dashboards.
- Portfolio Benchmarks: Occupancy, visit frequency, and visit duration compare across locations and against external benchmarks.
- Right-Sizing Recommendations: Underused locations get suggested fixes, each with estimated occupancy, commercial value, and environmental impact.
- Lease-to-Occupancy Reporting: Rent obligations appear alongside utilization data, so cost per occupied square foot is visible per location.
- Occupancy-Triggered Operations: Cleaning, food orders, and other facility processes can run automatically based on measured occupancy.
Best for: Organizations that need a fast, hardware-free starting point for utilization insights using their existing Wi-Fi network.
InnerSpace
InnerSpace is a workplace analytics platform that produces location and movement data from a building's existing Wi-Fi network. Its positioning technology locates people to within a few feet, which supports desk-level and zone-level insights without installing sensors.
How InnerSpace Measures and Improves Space Utilization
InnerSpace connects to the Wi-Fi access points a building already runs. The platform tracks where people are within a space, adding location precision to basic presence data. That precision turns occupancy data into spatial behavior data, such as movement patterns across floors, dwell time in each area, and how often teams gather in different space types.
Those measurements feed dashboards that report utilization from the portfolio level down to individual desks. Teams can compare occupancy against area per person and time on site to judge whether a space performs as intended. The analytics also support cost calculations, like cost per employee by property.
All personally identifiable data is anonymized, and the platform carries ISO 27001 and GDPR certifications. An API makes the underlying data available to other tools.
Key Features
- Sensor-Free Measurement: Existing Wi-Fi access points supply the data, with no hardware to install or maintain.
- Location Positioning: Wi-Fi fingerprinting locates people precisely enough for desk and zone-level analysis.
- Movement and Dwell Analytics: The platform maps how people navigate spaces, how long they stay, and how usage differs by team.
- Portfolio-to-Desk Reporting: Utilization metrics roll up across buildings or drill down to individual workpoints.
- Cost and Performance Metrics: Dashboards calculate figures like cost per employee and compare properties against usage expectations.
- No Hardware Rollout: Setup runs on the existing network, so deployment doesn't wait on sensor installation.
Best for: Workplace and CRE teams that want spatial behavior insights, such as movement and dwell patterns, without installing sensing hardware.
FM:Systems
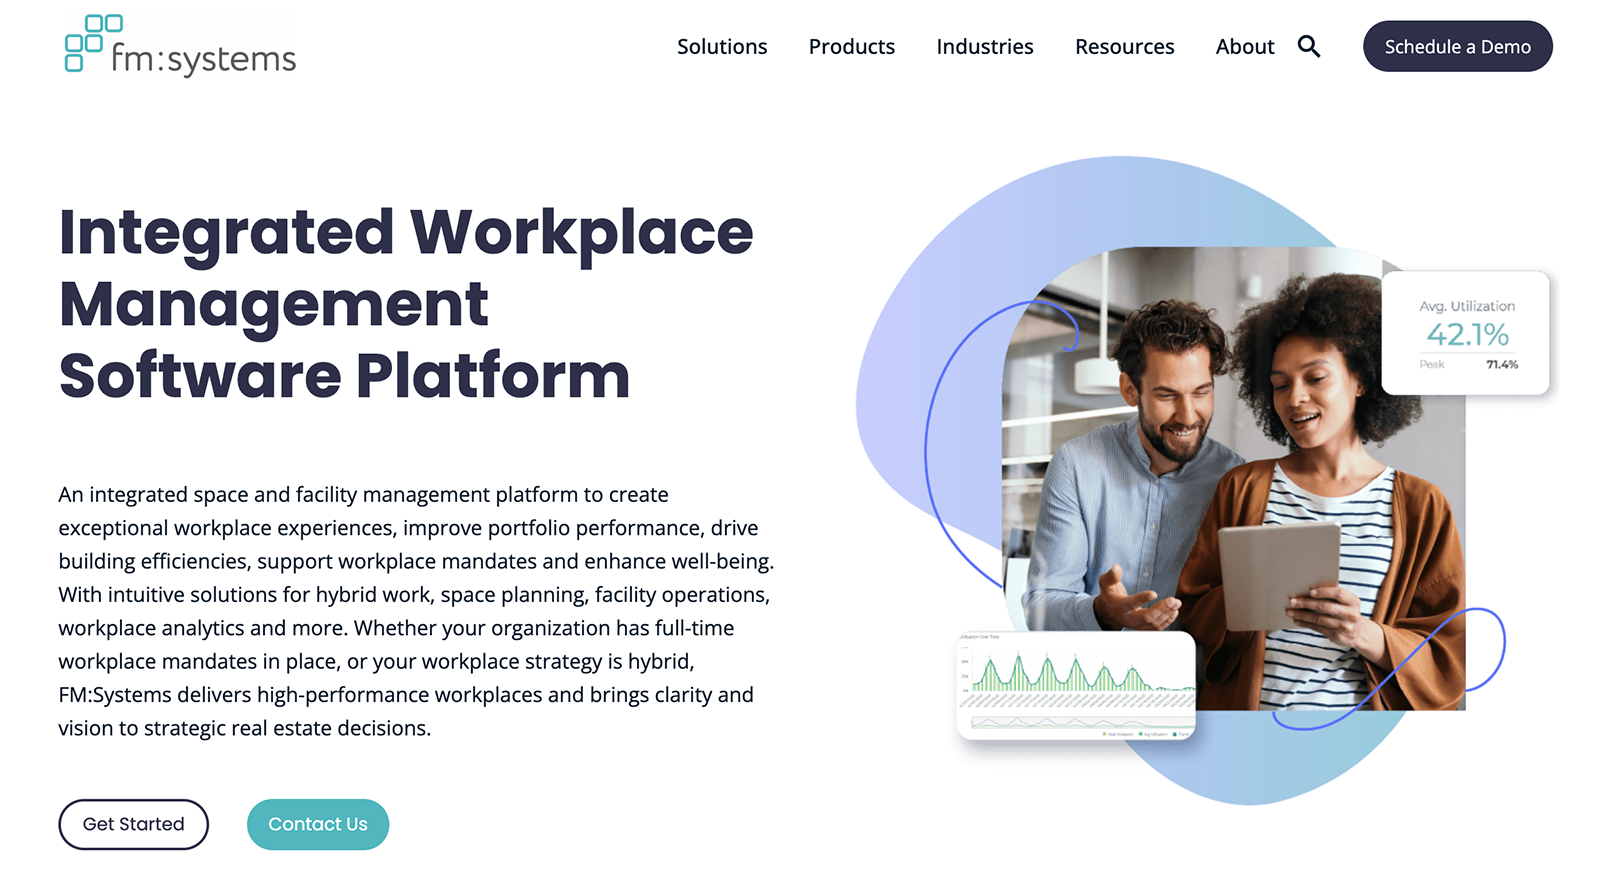
FM:Systems is an IWMS. The platform spans space and portfolio management, facility maintenance, desk and room booking, visitor management, and workplace analytics. It serves large organizations across corporate, government, healthcare, finance, and higher education.
How FM:Systems Measures and Improves Space Utilization
FM:Systems takes a planning-centric approach to utilization. Teams can use it to manage their space inventory, floor plans, and allocation records in the platform, then connect occupancy and booking data to see how each space performs. Analytics flag underperforming areas and feed capacity planning, move management, and scenario planning for future layouts.
Occupancy data can come from several places. FM:Systems sells its own workplace sensors, and its analytics also take in booking activity and data from third-party sensing hardware. Real-time dashboards and performance scoring translate those inputs into portfolio-level comparisons.
The platform's depth suits organizations with complicated footprints. Teams can plan and execute office moves, model consolidation scenarios before committing, track leases alongside space records, and tie maintenance operations to the same data. This breadth is also a trade-off, since an IWMS is a bigger implementation than a standalone measurement tool.
Key Features
- Space and Portfolio Management: A central inventory tracks space allocation, floor plans, and costs across buildings and regions.
- Move Management: Teams plan, coordinate, and execute office moves within the same system that holds the space data.
- Scenario Planning: Consolidations, expansions, and layout changes can be modeled before any physical work starts.
- Utilization and Booking Analytics: Occupancy data and reservation activity combine to show which spaces underperform.
- Workplace Sensors: The company offers its own sensor line and also accepts data from third-party occupancy hardware.
- Facility Operations: Maintenance, asset management, and work orders run on the same platform as space planning.
Best for: Large enterprises with complex, multi-site portfolios that need a full IWMS for space planning, move management, and portfolio-level analytics.
Archilogic
Archilogic is a spatial data platform that turns floor plans into structured, queryable information. Every wall, room, desk, and asset in a building becomes part of a live digital model that teams edit in a browser, with no CAD software required. Other workplace tools then read from and build on that spatial record.
How Archilogic Measures and Improves Space Utilization
Archilogic leaves occupancy measurement to other platforms and focuses on the spatial foundation underneath utilization work. The platform holds a building's space inventory, including room types, seat capacities, and area calculations that follow the Building Owners and Managers Association (BOMA) standard and update with every edit.
Occupancy and booking data flow in through integrations with workplace management and sensor platforms. With those connections, utilization numbers attach to real spaces on real floor plans instead of living in a separate spreadsheet.
For planning, teams edit floor plans directly in the browser and keep a version history, so layout changes can be drafted, compared, and rolled back before anything physical happens. Developers can also query the spatial data through an API, and AI tools can access it to answer questions about a portfolio, such as finding every meeting room above a given capacity.
Key Features
- Browser-Based Floor Plan Editing: Teams update plans in the browser without CAD licenses, with versioning and rollback built in.
- Structured Space Inventory: Rooms, desks, and assets exist as queryable data with semantic relationships, not static drawings.
- Automated Area Calculations: Rentable and usable areas recompute on every edit, following the BOMA standard.
- Compliance Checks: Design standards and building codes, such as Americans with Disabilities Act (ADA) requirements, can be checked automatically against the plan data.
- PropTech Integrations: Workplace management, IWMS, IoT, and occupancy platforms sync with the spatial record.
- Developer and AI Access: An API and software development kit (SDK) let teams embed interactive floor plans and run portfolio-wide spatial queries.
Best for: Workplace strategy teams that need to visualize, model, and plan space changes before committing to physical reconfigurations.
REKalibrate
REKalibrate is a data science platform for commercial office real estate, aimed at building owners and asset managers rather than the companies occupying the space. It consolidates data from a building's operational systems and analyzes how tenants use space and amenities. The goal is helping owners improve engagement, retention, and portfolio performance.
How REKalibrate Measures and Improves Space Utilization
REKalibrate starts with data integration. The platform connects to a building's existing operational systems, then cleans and standardizes the data into one view of property performance. It doesn't sell sensors, so utilization signals come from whatever systems a building already runs.
From that unified data, the platform tracks how tenants use their leased space and which amenities they engage with. Those patterns feed renewal-risk indicators, so asset managers can spot tenants whose declining usage suggests churn ahead and act before a lease decision arrives. Amenity analysis shows which investments earn their keep.
Reporting is tailored by role, with views for asset managers, property managers, leasing teams, and hospitality staff. The company pairs the platform with advisory support, working with clients to turn findings into strategy.
Key Features
- Data Integration and Cleaning: Building systems connect into one standardized dataset, with automated cleaning and data pipelines.
- Utilization and Efficiency Tracking: Analytics show how tenants use their leased space across a property or portfolio.
- Amenity Engagement Analysis: Usage data reveals which amenities drive engagement and return on investment.
- Renewal Risk Indicators: Usage and engagement trends flag tenants at risk of not renewing.
- Role-Specific Reporting: Asset managers, leasing teams, and property staff each get views suited to their decisions.
- Advisory Support: Data science experts help translate findings into asset strategy.
Best for: Office owners and asset managers who want tenant engagement, utilization, and retention insights drawn from their buildings' operational data.
Which Tool Fits Which Problem
These ten platforms solve different parts of the utilization puzzle, and many organizations run two or more together.
If you need to measure how many people are physically in the building, start with a sensing or network-based platform (Butlr for anonymous thermal sensing, Basking or InnerSpace for Wi-Fi-based measurement).
If your primary gap is managing bookings and hybrid schedules, Robin, Envoy, and HubStar each handle that with built-in utilization reporting.
For portfolio-level planning, scenario modeling, and move management, FM:Systems and Smarten Spaces go deepest.
Archilogic adds structured floor plan data that other tools build on, and REKalibrate serves building owners tracking tenant engagement and renewal risk.
.png)

%20(1).png)
.png)
.webp)