


.svg)


Workplace Utilization: 5 Metrics That Show Where Costs Leak
Decision makers estimate that 24% of their office space goes unused or underused in a typical week. These five metrics show you where that waste lives and how to stop it.
Most organizations are overspending on space they don't fully use, and they don't have the numbers to prove it.
According to Butlr’s 2026 State of Office Space Report, a survey of 400 U.S. buildings and facilities decision makers, only 19% say their space-planning decisions are based mostly on data. More than a third (36%) rely more or mostly on gut instinct and experience. Nearly two-thirds (62%) have no way to learn about unexpected uses of space without directly asking or observing employees.
Nearly all respondents (99%) say uncertainty about how space is used has disrupted business plans over the past five years, from delayed expansions to canceled renovations to postponed energy investments.
This article breaks down what workplace utilization actually measures, where the biggest cost leaks hide, and five metrics that give you the data to act on them.
What Is Workplace Utilization?
Workplace utilization measures how effectively people use physical space relative to its capacity and availability over time. It tracks how full a space is, how often it's occupied, and whether the types of spaces you've built match how people work.
Headcount only tells you how many people entered a building on a specific day. Utilization data can show that:
- The fourth floor ran at 80% capacity while the third floor was half-empty
- Six-person huddle rooms were booked 40 times last week while two 20-person boardrooms went unused
- Your cafeteria doubles as a de facto meeting space every afternoon because there aren't enough bookable rooms
Utilization vs. Occupancy
These two terms are often used interchangeably, but they measure different things and drive different decisions.
- Occupancy is a snapshot showing whether people are present
- Utilization is a trend showing how well the space performs over time
Say a conference room is booked from 9 a.m. to 5 p.m. every day, so occupancy looks high. If every meeting has three people in a 12-seat room, utilization is low, and you're paying to light, cool, and clean a room running at 25% of its capacity.
For enterprise teams managing large portfolios, utilization data shows whether a floor needs more collaboration areas or fewer individual desks, whether you're over-built for the way people work, and whether a lease renewal makes sense at the current square footage.
Where the Money Leaks
Missing utilization data doesn't just create uncertainty. It creates recurring costs that compound across every building in a portfolio. Two areas account for most of the waste.
Cleaning
Our survey shows that 82% of cleaning schedules aren't based on occupancy data for individual spaces. Two-thirds of organizations clean all areas at the same frequency regardless of usage, and 60% cite cleaning costs as one of their top targets for savings.
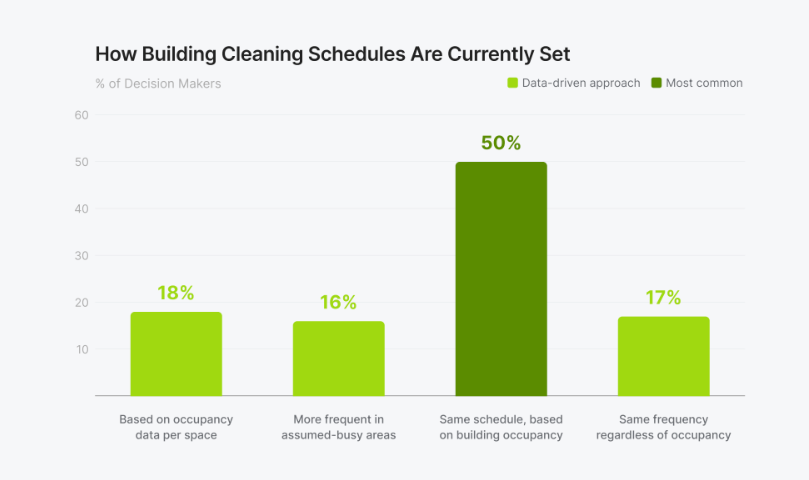
Empty conference rooms get the same wipe-down as high-traffic cafeterias. Restrooms on vacant floors get serviced on the same rotation as those next to a 200-person team.
Energy
Energy costs are the top area where respondents say better utilization data could save money, cited by 62%.
If a floor is empty every Friday, running climate control on that floor five days a week means 20% of that floor's energy spend is wasted. Scale that across a portfolio of 50 or 100 floors, and the waste compounds fast.
HVAC systems that run on building-wide schedules, without responding to where people are, create hidden operating costs.
RTO Mandates Are Making the Problem Worse
These costs are growing as return-to-office policies accelerate without the data to support them. According to the Flex Report Q3 2025, 34% of U.S. firms now require full-time office presence, up 2 points from the prior year. Among Fortune 100 companies, 29% require full-time office attendance, and 45% require four or five days per week.
But mandates aren't translating into predictable space use. The Flex Report shows that while required office days increased by 12% from early 2024 through Q3 2025, actual attendance rose by only 1-3%. Companies are mandating presence without knowing whether their spaces fit how people will use them.
A building at 40% average utilization may be better served by fewer floors with better office layouts, or by a shift from assigned desks to shared neighborhoods. You need utilization data to make that call.
Mandates also raise expectations for the space itself. For the office to justify the commute, it needs better collaboration spaces, social connection, and environments built for concentration. Someone who commutes 45 minutes to sit in an open floor plan, join video calls with remote colleagues, and struggle to find a private room for focused work will likely question the value of their time.
Our survey shows that 99% of decision makers expect more efficient workspaces to pay off beyond cost savings. Increased employee productivity was cited most often (59%), followed by improved employee focus (52%), greater collaboration (47%), and greater cleanliness (47%).
Over three-quarters (78%) believe better office design would improve employee retention, and among those who prioritize understanding space use, 41% expect a major improvement. Utilization data tells you whether your space supports that kind of workday or works against it.
5 Metrics That Expose the Waste
Occupancy rates alone can't show what's happening across your portfolio. Each of these five metrics maps to a specific type of waste or missed opportunity.
These metrics are most useful when layered together. A conference room with high booking rates, low peak occupancy, and short dwell times calls for a different response than one that's consistently full. The first is a candidate for demand-based cleaning and a smaller room swap, while the second might need a duplicate nearby.
What to Do With Utilization Data
The metrics above point to four kinds of changes to your portfolio, operations, and floor plans.
Right-Size Before Expanding
Before you sign new leases or add square footage, utilization data can show whether your existing space is simply misconfigured.
Organizations with consistent sub-50% average utilization rates across floors have consolidation opportunities. Those with high peak-day utilization but low weekly averages may need flexible configurations instead of additional real estate.
Consider a company with four floors averaging 45% utilization. The instinct might be to keep all four because Tuesdays and Wednesdays hit 80%.
But combining average utilization data with mobility ratios might show that three floors at a 1.5:1 desk ratio, with bookable overflow space for peak days, can serve the same workforce at lower cost. The fourth floor can become a sublease opportunity or a lease you don't renew.
Automate Cleaning and Maintenance
Since so few cleaning schedules are tied to occupancy data, this is one of the most immediate opportunities. Real-time dwell time and peak occupancy data from occupancy sensors lets cleaning crews focus on spaces that were used rather than servicing empty rooms on a fixed rotation.
For large portfolios, this approach reduces labor costs while keeping high-traffic areas cleaner.
Say you manage 10 buildings and each one has two floors that sit empty most Fridays. Skipping those floors on low-traffic days could cut 15-20% of contracted cleaning hours for those buildings without anyone noticing the difference.
Optimize Energy Consumption
Connecting average utilization rates and peak occupancy data to building management systems (BMS) and integrated workplace management systems (IWMS) makes demand-based climate control possible. HVAC systems can then respond to where people are.
At the zone level, unoccupied sections of a floor can be set back to energy-saving temperatures while occupied zones stay comfortable. At the building level, floors with no scheduled occupancy can run minimal climate control.
Validate That Space Design Matches How People Work
Space type utilization data reveals whether the shift toward collaboration zones is warranted or whether teams need more focus rooms. A 20-person boardroom consistently used by groups of four is misallocated, however full its booking calendar looks. Splitting it into two huddle rooms would raise combined utilization.
When common areas become de facto meeting rooms, it's a sign that bookable rooms are always full. Combining space type utilization with dwell time data shows which rooms are overbooked and whether people are using them for the full booked duration. With that data, facilities and corporate real estate teams can redesign around how people use the space.
How to Collect Utilization Data That's Actually Useful
Our State of Office Space survey asked decision makers which tools they currently use to understand space usage. Most rely on methods that measure intent or entry rather than what happens inside the building.

Reservations and surveys measure what people plan to do or say they do. A conference room can be booked and never used, and most organizations don't track no-shows. Survey feedback depends on perception and memory.
Badge swipes confirm building entry but say nothing about what happens after the turnstile. Someone who badges in at 8 a.m. and leaves at 6 p.m. could have spent the entire day on one floor or moved between five of them.
Manual headcounts, still used by nearly four in ten organizations, show a single snapshot and miss broader usage patterns. A facility manager walking a floor at 10 a.m. on a Wednesday will count the morning peak, miss the afternoon lull, and have no data on Thursday at all.
Wi-Fi and network login data can place someone on a floor based on their connected devices, but rarely in a specific room. It also misses visitors, contractors, and anyone not on the corporate network.
Over half (53%) of respondents already use sensor-based occupancy data, and that number rises to 69% among those managing building utilities. Occupancy sensors capture room-level occupancy patterns that badge systems and surveys can't.
Even so, 79% of survey respondents say data challenges have hindered their ability to make layout changes.
The Privacy Barrier
For many enterprise organizations, the main obstacle is privacy.
Nearly all decision makers (92%) view privacy as a barrier to getting utilization data, and 63% call it a moderate-to-major one.
Larger companies feel this more acutely, with 69% of decision makers at companies with 1,000+ employees rating privacy a moderate-to-major barrier, compared to 52% at smaller companies.
The organizations with the most complex space challenges are also the most constrained by privacy concerns. Global portfolios, multi-tenant buildings, regulated industries, and companies with European works councils all face heightened scrutiny around sensor technology.
The technology you choose determines whether legal, IT security, and works councils approve deployment or send it back for months of review.
Camera-based occupancy systems, even those that process data on-device, still contain camera hardware. That physical presence is often enough to trigger extended legal review, DPIA requirements under GDPR, and works council pushback.
Butlr takes a different approach. Our thermal-only sensors detect body heat and capture no images. With no camera lens in the hardware, there's no image capture for legal teams to debate. That typically speeds up legal and works council approval, simplifies GDPR compliance by removing the overhead of managing visual data, and wins employee acceptance without a change management campaign.
Learn more about how Butlr can help you see how your workplace is really used.
.png)

%20(1).png)
.png)
.webp)